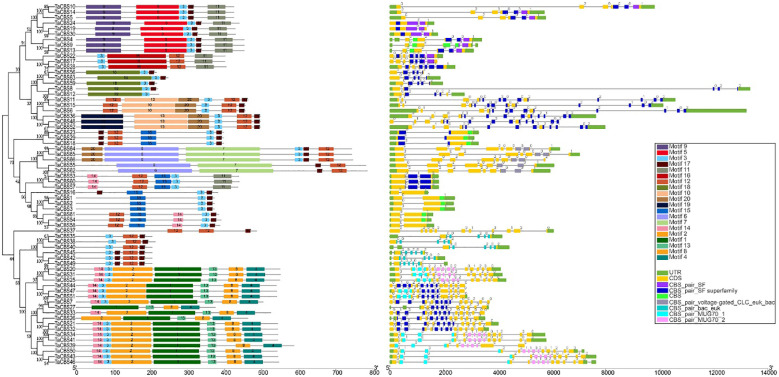
Figure 2.
Phylogenetic relationship, conserved motifs, gene structure, and conserved domain of TaCBS proteins. Different colors are used to represent different motifs in the figure and in the upper right corner. Black lines represent non-conserved sequences in MEME results and introns in the exon-intron structure, respectively. The phylogenetic tree is constructed similarly to Figure 1.

