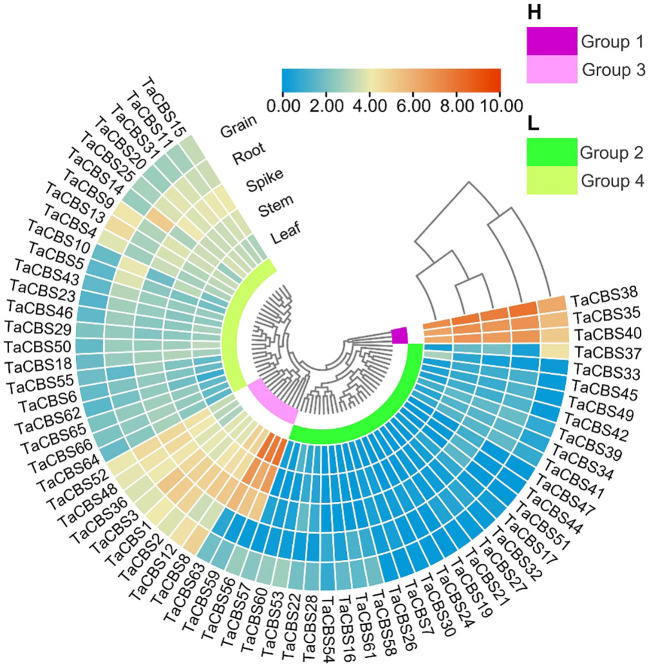
Figure 7.
The differential expression of representative genes encoding CDCPs in different tissues by RNA-seq data reported in WheatOmics. The legend represents the log transcripts per kilobase million (TPM) values. The transcriptome expression results are shown as a heat map in blue/yellow/brownish red colors. The clusters of low and high expression are represented by different colors.

