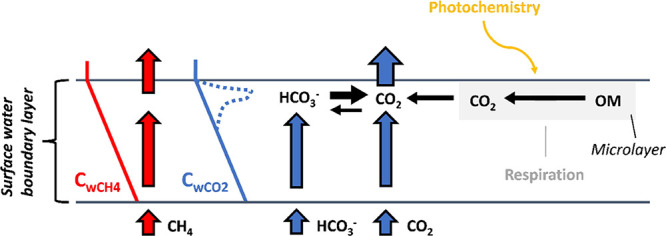
Figure 3.

Conceptual figure for potential effect of chemical reactivity and degradation processes in the surface microlayer on concentration gradients of CO2 (blue dashed line) in relation to assumed concentration gradients for CO2 or CH4 without CO2 reactivity (solid lines in blue and red, respectively) in waters supersaturated with both CO2 and CH4. Please note that our intention with the figure is to present processes that contributes to the increase of apparent k600 for CO2 relative to CH4, hence relating to the findings from our empirical measurements. Therefore, we chose not to include processes in the figure that have the opposite effect, i.e., enhancing apparent k600 for CH4, e.g., by the contribution of microbubbles or other processes that may be the result of sampling bias.
