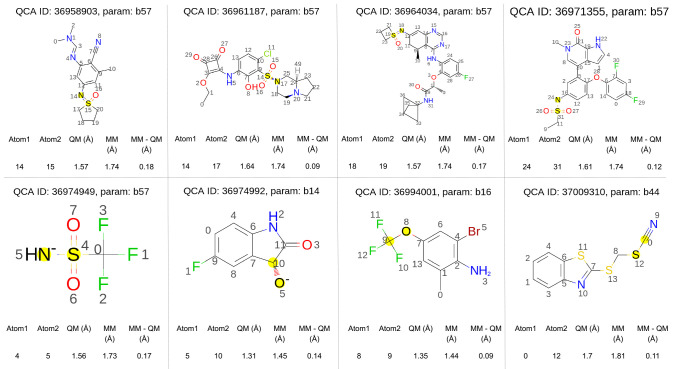
Figure 9.
Representative molecules from the outliers in the bond-stretch RMSD box plot (Figure 8) using Sage 2.0.0. The major bond deviation with respect to the QM minimized structure is quantified below each molecule, and the bond parameter applied is given above each molecule, along with its QCArchive record id. Bond parameter b57, with the SMIRKS pattern [#16X4,#16X3:1]∼[#7:2], is a frequent offender.

