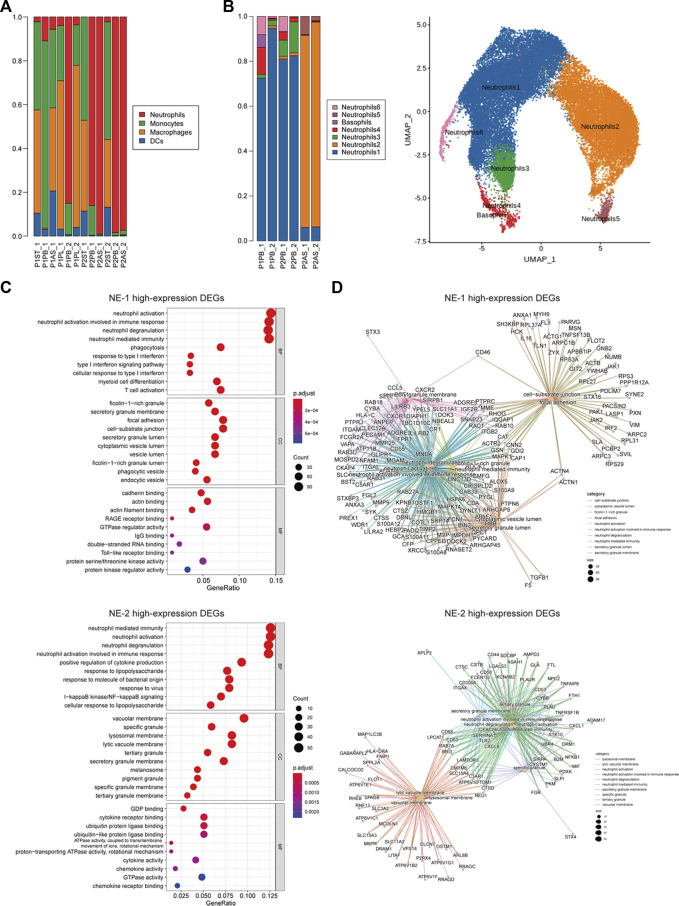
FIGURE 2.
Cellular constitution of myeloid cells in peripheral blood samples and cellular subcluster analysis of neutrophils. (A) Cellular constitution of myeloid cells in peripheral blood samples; (B) cellular subcluster of neutrophils in peripheral blood and ascites samples; (C) dot plots of GO analysis of high-expression DEGs of neutrophil cluster 1 (NE-1) and cluster 2 (NE-2); and (D) net plots of GO analysis of high-expression DEGs of NE-1 and NE-2.

