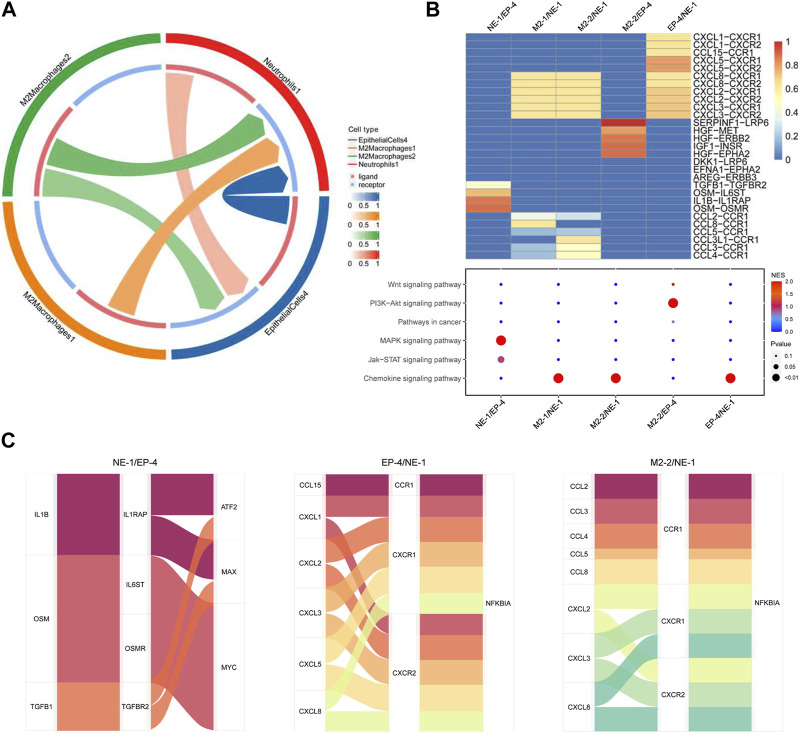
FIGURE 5.
Cellular interaction analysis among neutrophils, malignant epithelial cells, and M2 macrophages. (A) Cell network of NE-1, EP-4, M2-1, and M2-2 was analyzed using CellCall; (B) heatmap of ligand–receptor interactions among NE-1, EP-4, M2-1, and M2-2. Signaling pathways involved in ligand–receptor interactions were analyzed KEGG enrichment analysis; (C) Sankey diagram displayed transcript factors downstream of the signaling pathway.

