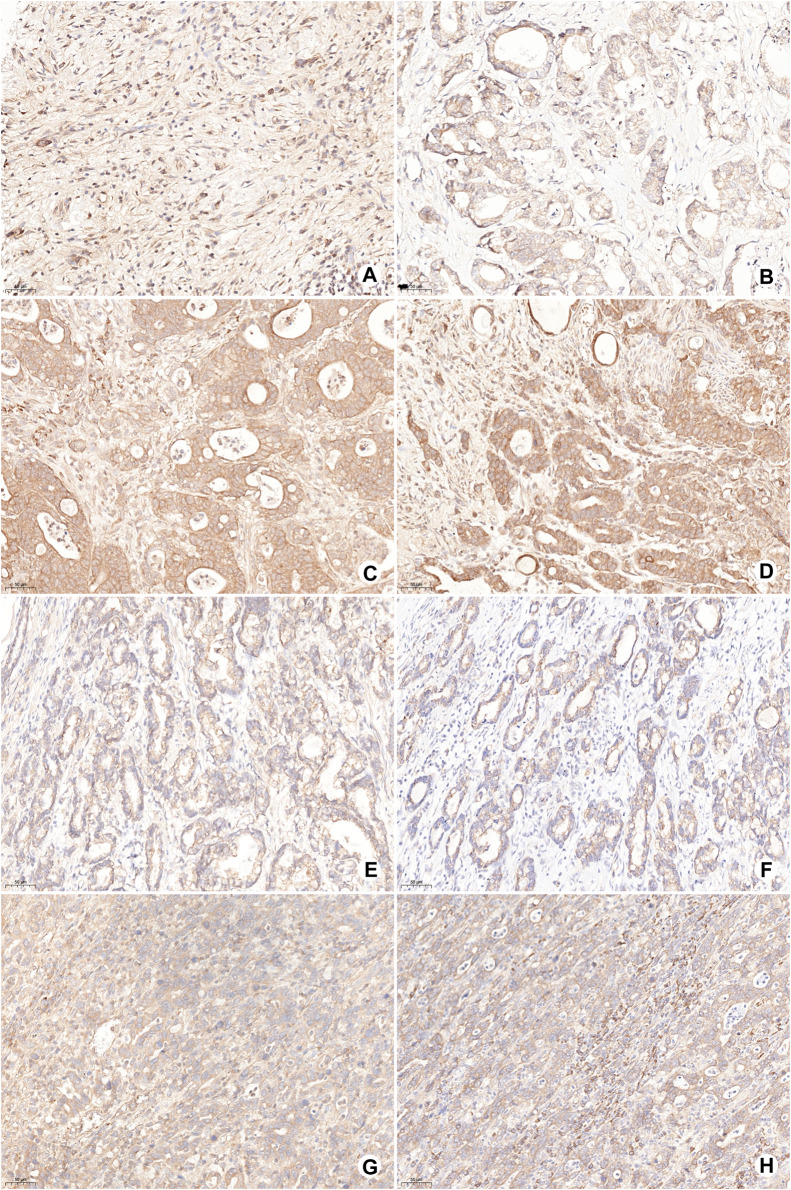
FIGURE 6.
Representative images of OSMR, SERPINF1, and LRP6 expression in gastric cancer samples by IHC. (A,B) Low expression of OSMR in tumor cells; (C,D) high expression of OSMR in tumor cells; (E) low expression of LRP6 in tumor cells; (F) low expression of SERPINF1 in stromal cells; (G) high expression of LRP6 in tumor cells; and (H) high expression of SERPINF1 in stromal cells.

