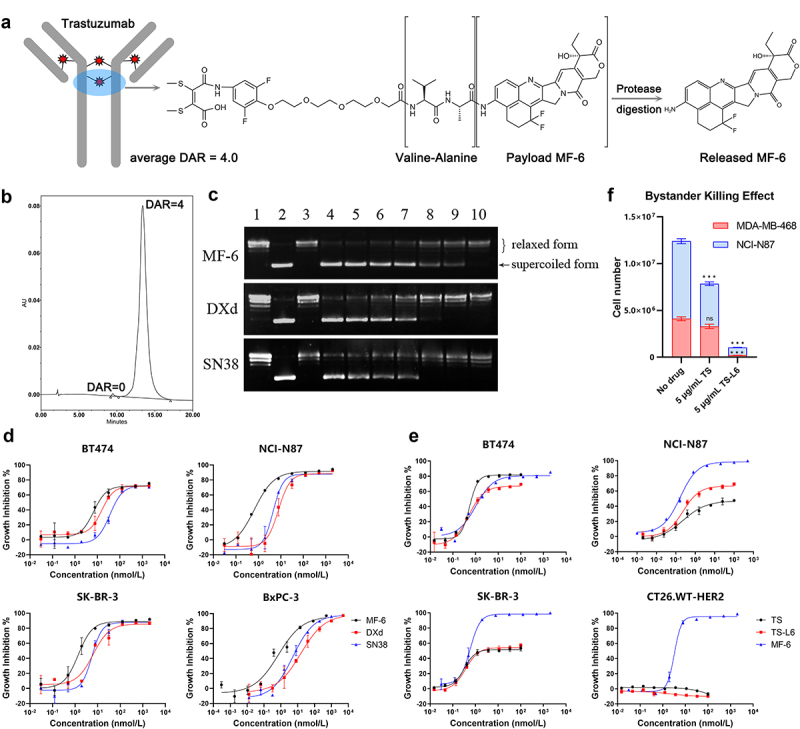
Figure 1.

Structure and cytotoxicity of TS-L6.
a, Trastuzumab-L6 was composed of trastuzumab, a bridging valine-alanine linker between interchain disulfide bonds, and a topoisomerase I inhibitor MF-6, released by protease digestion.
b, The hydrophobic interaction chromatography chart of TS-L6 indicated a homogenous distribution with a drug–antibody ratio (DAR) of mostly 4.0.
c, The transformation of supercoiled plasmid into relaxed or nicked plasmid by DNA topoisomerase I in the presence of MF-6, DXd, and SN38 inhibitors was used to measure the activity of those three inhibitors. After the catalysis reaction was terminated, DNA agarose gel electrophoresis was used to separate the supercoiled plasmid with and nicked or relaxed plasmid; the supercoiled plasmid possessed higher migration rate due to tight conformation compared with nicked or relaxed plasmid. Lanes 1, 2, and 3 represent relaxed plasmid, supercoiled plasmid, and topoisomerase I only, respectively. Lanes 3 to 10 are a series of 2.5-fold dilutions of 100 μmol/L MF-6 (upper) and DXd (middle), and fivefold dilutions of 500 μmol/L SN38 (bottom).
d, Cytotoxicity of MF-6, DXd, and SN38 toward BT474, NCI-N87, SK-BR-3, and BxPC-3 cells was evaluated. Tumor cells were cultured with serially diluted drugs for 4 days. The cell growth inhibition ratio was calculated as the reduced cell viability signal in the drug-treated group compared with no drug treatment. The compound concentration and cell growth inhibition ratio were fitted with a four-parameter method to generate a dose–response curve.
e, Cytotoxicity of MF-6, TS, and TS-L6 toward HER2-expressing cells BT474, NCI-N87, SK-BR-3, and CT26.WT-HER2 was evaluated. Tumor cells were cultured with serially diluted drugs for 6 days. The cell growth inhibition ratio was calculated as the reduced cell viability signal in the drug-treated group compared with no drug treatment. The compound concentration and cell growth inhibition ratio were fitted with a four-parameter method to generate a dose–response curve.
f, Bystander killing effect of TS-L6 was evaluated using HER2-positive cell line NCI-N87 and HER2-negative cell line MDA-MB-468. When 5 μg/mL TS was added in the co-culture of the two cell lines, MDA-MB-468 was not affected (80.6 ± 9.7% of no drug group, P>0.05), but the growth of NCI-N87 was inhibited (54.9 ± 0.7% of no drug group, P<0.001). When 5 μg/mL TS-L6 was added, both NCI-N87 (10.1 ± 0.5% of no drug group, P<0.001) and MDA-MB-468 (5.0 ± 0.5% of no drug group, P<0.001) were inhibited.
