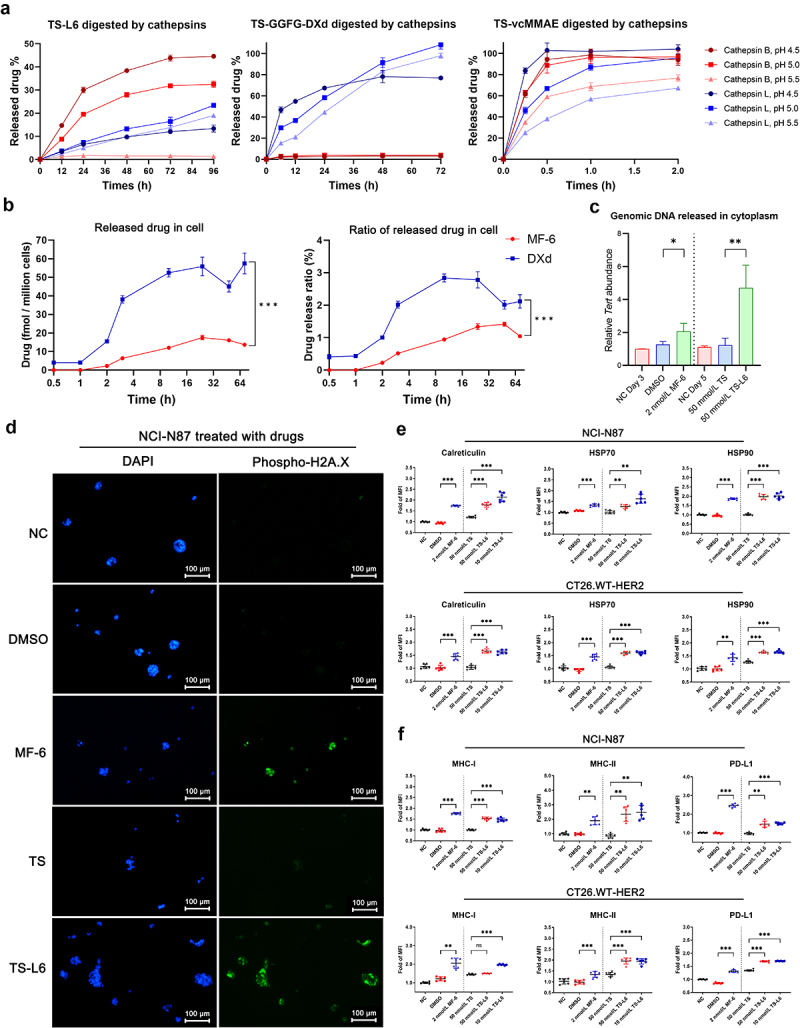
Figure 2.

Genomic DNA damage and DAMPs upregulation in tumor cells with drug treatment.
a, The drug release rate of TS-L6, TS-GGFG-DXd, and TS-vcMMAE was evaluated using cathepsin B and L at pH 4.5, 5.0, and 5.5. The cathepsin B and cathepsin L released 45% and 25% MF-6 from TS-L6 at the optimal pH condition after 96 h. The GGFG linker was more sensitive to cathepsin L, which released approximately all the DXd after 72 h; cathepsin B barely catalyzed DXd release. The traditional VC linker was more sensitive to both cathepsin B and L compared with VA and GGFG linker; after only 0.5 h, approximately all the MMAE was released. The release rates were TS-L6<TS-GGFG-DXd<TS-vcMMAE. Three independent tests were performed, and the data are shown as mean and SD.
b, The drug release of TS-L6 and TS-GGFG-DXd in tumor cells was evaluated on NCI-N87. After incubation for different times, the released drugs in cells were isolated for quantitative analysis. The released MF-6 in tumor cells was lower compared with released DXd at all the times (left), and the ratio of released MF-6 to total MF-6 carried by internalized TS-L6 was also lower compared with DXd (right). Three independent tests were performed, and the data are shown as mean and SD.
c, Genomic DNA of NCI-N87, indicated by the Tert gene, was released into the cytoplasm after MF-6 and TS-L6 treatment. When treated with 2 nmol/L MF-6 for 3 days, the amount of genomic DNA of NCI-N87 was significantly increased compared with DMSO (2.07 ± 0.48 vs. 1.27 ± 0.18, P<0.05). Similarly, when treated with 50 nmol/L TS-L6 for 5 days, the amount of genomic DNA was significantly increased compared with 50 nmol/L TS (4.71 ± 1.38 vs. 1.24 ± 0.42, P<0.01). Three independent tests were performed, and the data are shown as mean and SD.
d, Phosphorylated H2A.X (γ-H2A.X) level of NCI-N87 treated with MF-6 and TS-L6, which was a biomarker of genomic DNA damage, was assessed by immunofluorescence. The γ-H2A.X (green, stained with phosphorylated H2A.X antibody) was located in the nucleus (blue, stained with DAPI) and its nuclear abundance increased after MF-6 and TS-L6 treatment, thereby indicating genomic DNA damage.
e, When NCI-N87 and CT26.WT-HER2 were treated with 2 nmol/L MF-6 for 3 days or 50 nmol/L TS-L6 for 5 days, the cell surface DAMPs calreticulin, HSP70, and HSP90 significantly increased, compared with DMSO or 50 nmol/L TS treatment. For NCI-N87 cells, MF-6 treatment significantly increased calreticulin (1.74 ± 0.03 vs. 0.94 ± 0.03 folds, P<0.001), HSP70 (1.34 ± 0.06 vs. 1.08 ± 0.02 folds, P<0.001), and HSP90 (1.86 ± 0.05 vs. 0.96 ± 0.05 folds, P<0.001) on cell surface compared with DMSO. Similarly, compared with the 50 nmol/L TS treatment, 50 nmol/L TS-L6 treatment led to increase in calreticulin (1.78 ± 0.11 vs. 1.21 ± 0.04 folds, P<0.001), HSP70 (1.27 ± 0.09 vs. 1.01 ± 0.08 folds, P<0.01), and HSP90 (1.97 ± 0.13 vs. 1.01 ± 0.05 folds, P<0.001). Mouse cell line CT26.WT-HER2 also exhibited upregulated DAMPs after 2 nmol/L MF-6 or 50 nmol/L TS-L6 treatment. Six independent tests were performed, and the data are shown as mean and SD.
f, When NCI-N87 and CT26.WT-HER2 were treated with 2 nmol/L MF-6 for 3 days or 50 nmol/L TS-L6 for 5 days, the MHC-I, MHC-II, and PD-L1 on the tumor cell surface significantly increased, compared with DMSO or 50 nmol/L TS treatment. For NCI-N87 cells, 2 nmol/L MF-6 treatment significantly increased MHC-I (1.77 ± 0.04 vs. 0.97 ± 0.07 folds, P<0.001), MHC-II (1.91 ± 0.28 vs. 0.98 ± 0.07 folds, P<0.01) and PD-L1 (2.46 ± 0.09 vs. 0.99 ± 0.03 folds, P<0.001) on cell surface compared with DMSO. Similarly, compared with the 50 nmol/L TS treatment, 50 nmol/L TS-L6 treatment led to increase in MHC-I (1.53 ± 0.07 vs. 1.00 ± 0.03 folds, P<0.001), MHC-II (2.35 ± 0.50 vs. 0.85 ± 0.14 folds, P<0.01) and PD-L1 (1.47 ± 0.16 vs. 0.96 ± 0.05 folds, P<0.001). Mouse tumor cell CT26.WT-HRR2 also exhibited upregulated MHC-I, MHC-II, and PD-L1 after MF-6 or TS-L6 treatment. Six independent tests were performed, and the data are shown as mean and SD.
ns, *, ** and *** represent no significance, P<0.05, 0.01, and 0.001, respectively.
