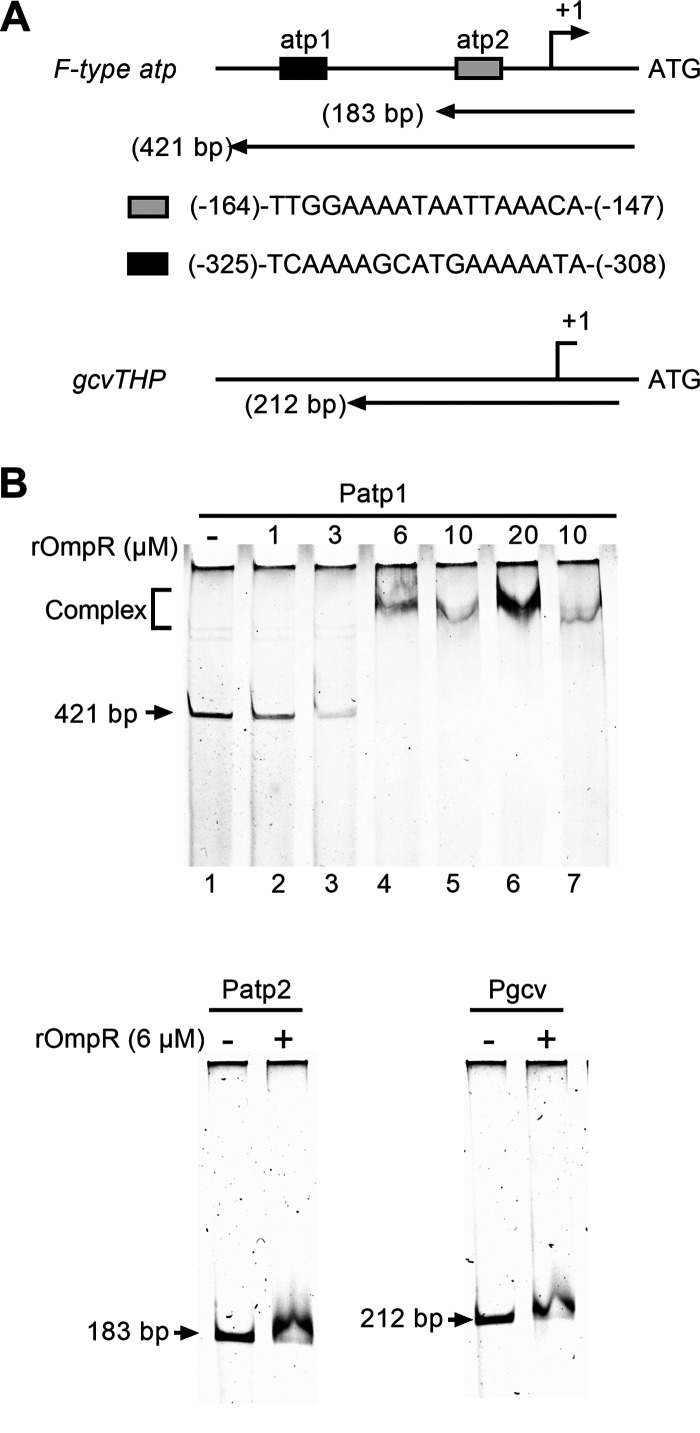
FIG 6.
EMSA analysis of binding of recombinant OmpR to the F-type atp operon and gcvTHP promoter regions. (A) Diagrams of promoter regions of F-type atp operon and gcvTHP (not drawn to scale). Gray and black boxes represent two putative OmpR binding sequences, atp1 and atp2. Nucleotide numberings are relative to the atpI and gcvT ATG codons, respectively. The relative positions and lengths of the three DNA fragments used in EMSA are shown. (B) EMSA results of rOmpR. EMSA of Patp1 (Upper panel): the Patp1 DNA fragment was mixed with increasing concentrations of rOmpR-P (in the presence of acetyl phosphate) at 0, 1, 3, 6, 10, and 20 μM (Lanes 1 to 6) or 10 μM non-P rOmpR (in the absence of acetyl phosphate) (lane 7). EMSA of Patp2 and Pgcv (Lower panels) DNA fragments specified in the absence and presence of 6 μM rOmpR-P (in the presence of acetyl phosphate), respectively (−/+), were analyzed. DNA bands were detected by Gelred staining. The positions of DNA fragments not shifted were labeled.

