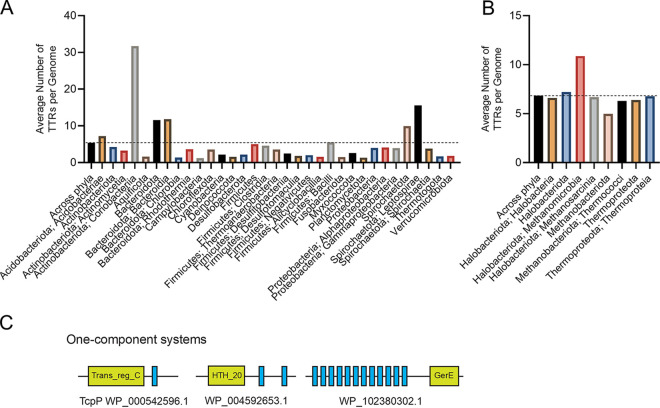
FIG 1.
(A and B) Abundance of TTRs among bacterial (A) and archaeal (B) genomes. The dashed line indicates the average number of TTRs per genome across all phyla. Bacterial and archaeal phylum are listed below their respective groups, with the class following a semicolon. To view the supporting data, see File S7 in the supplemental material. (C) Typical membrane topology and domain composition of one-component TTRs identified in this study.

