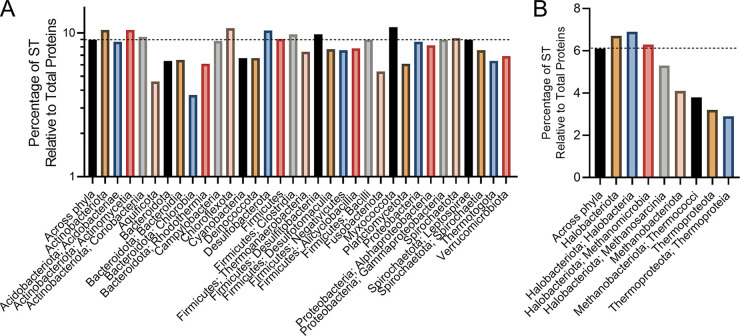
FIG 4.
(A and B) Ratio of non-TTR signal transduction genes to total protein-coding genes among bacterial (A) and archaeal (B) genomes. The dashed line indicates the average ratio of signal transduction genes to protein-coding genes across all phyla. Bacterial and archaeal phylum are listed below their respective groups, with the class following a semicolon. To view the supporting data, see File S7 in the supplemental material.

