
FIG 3.
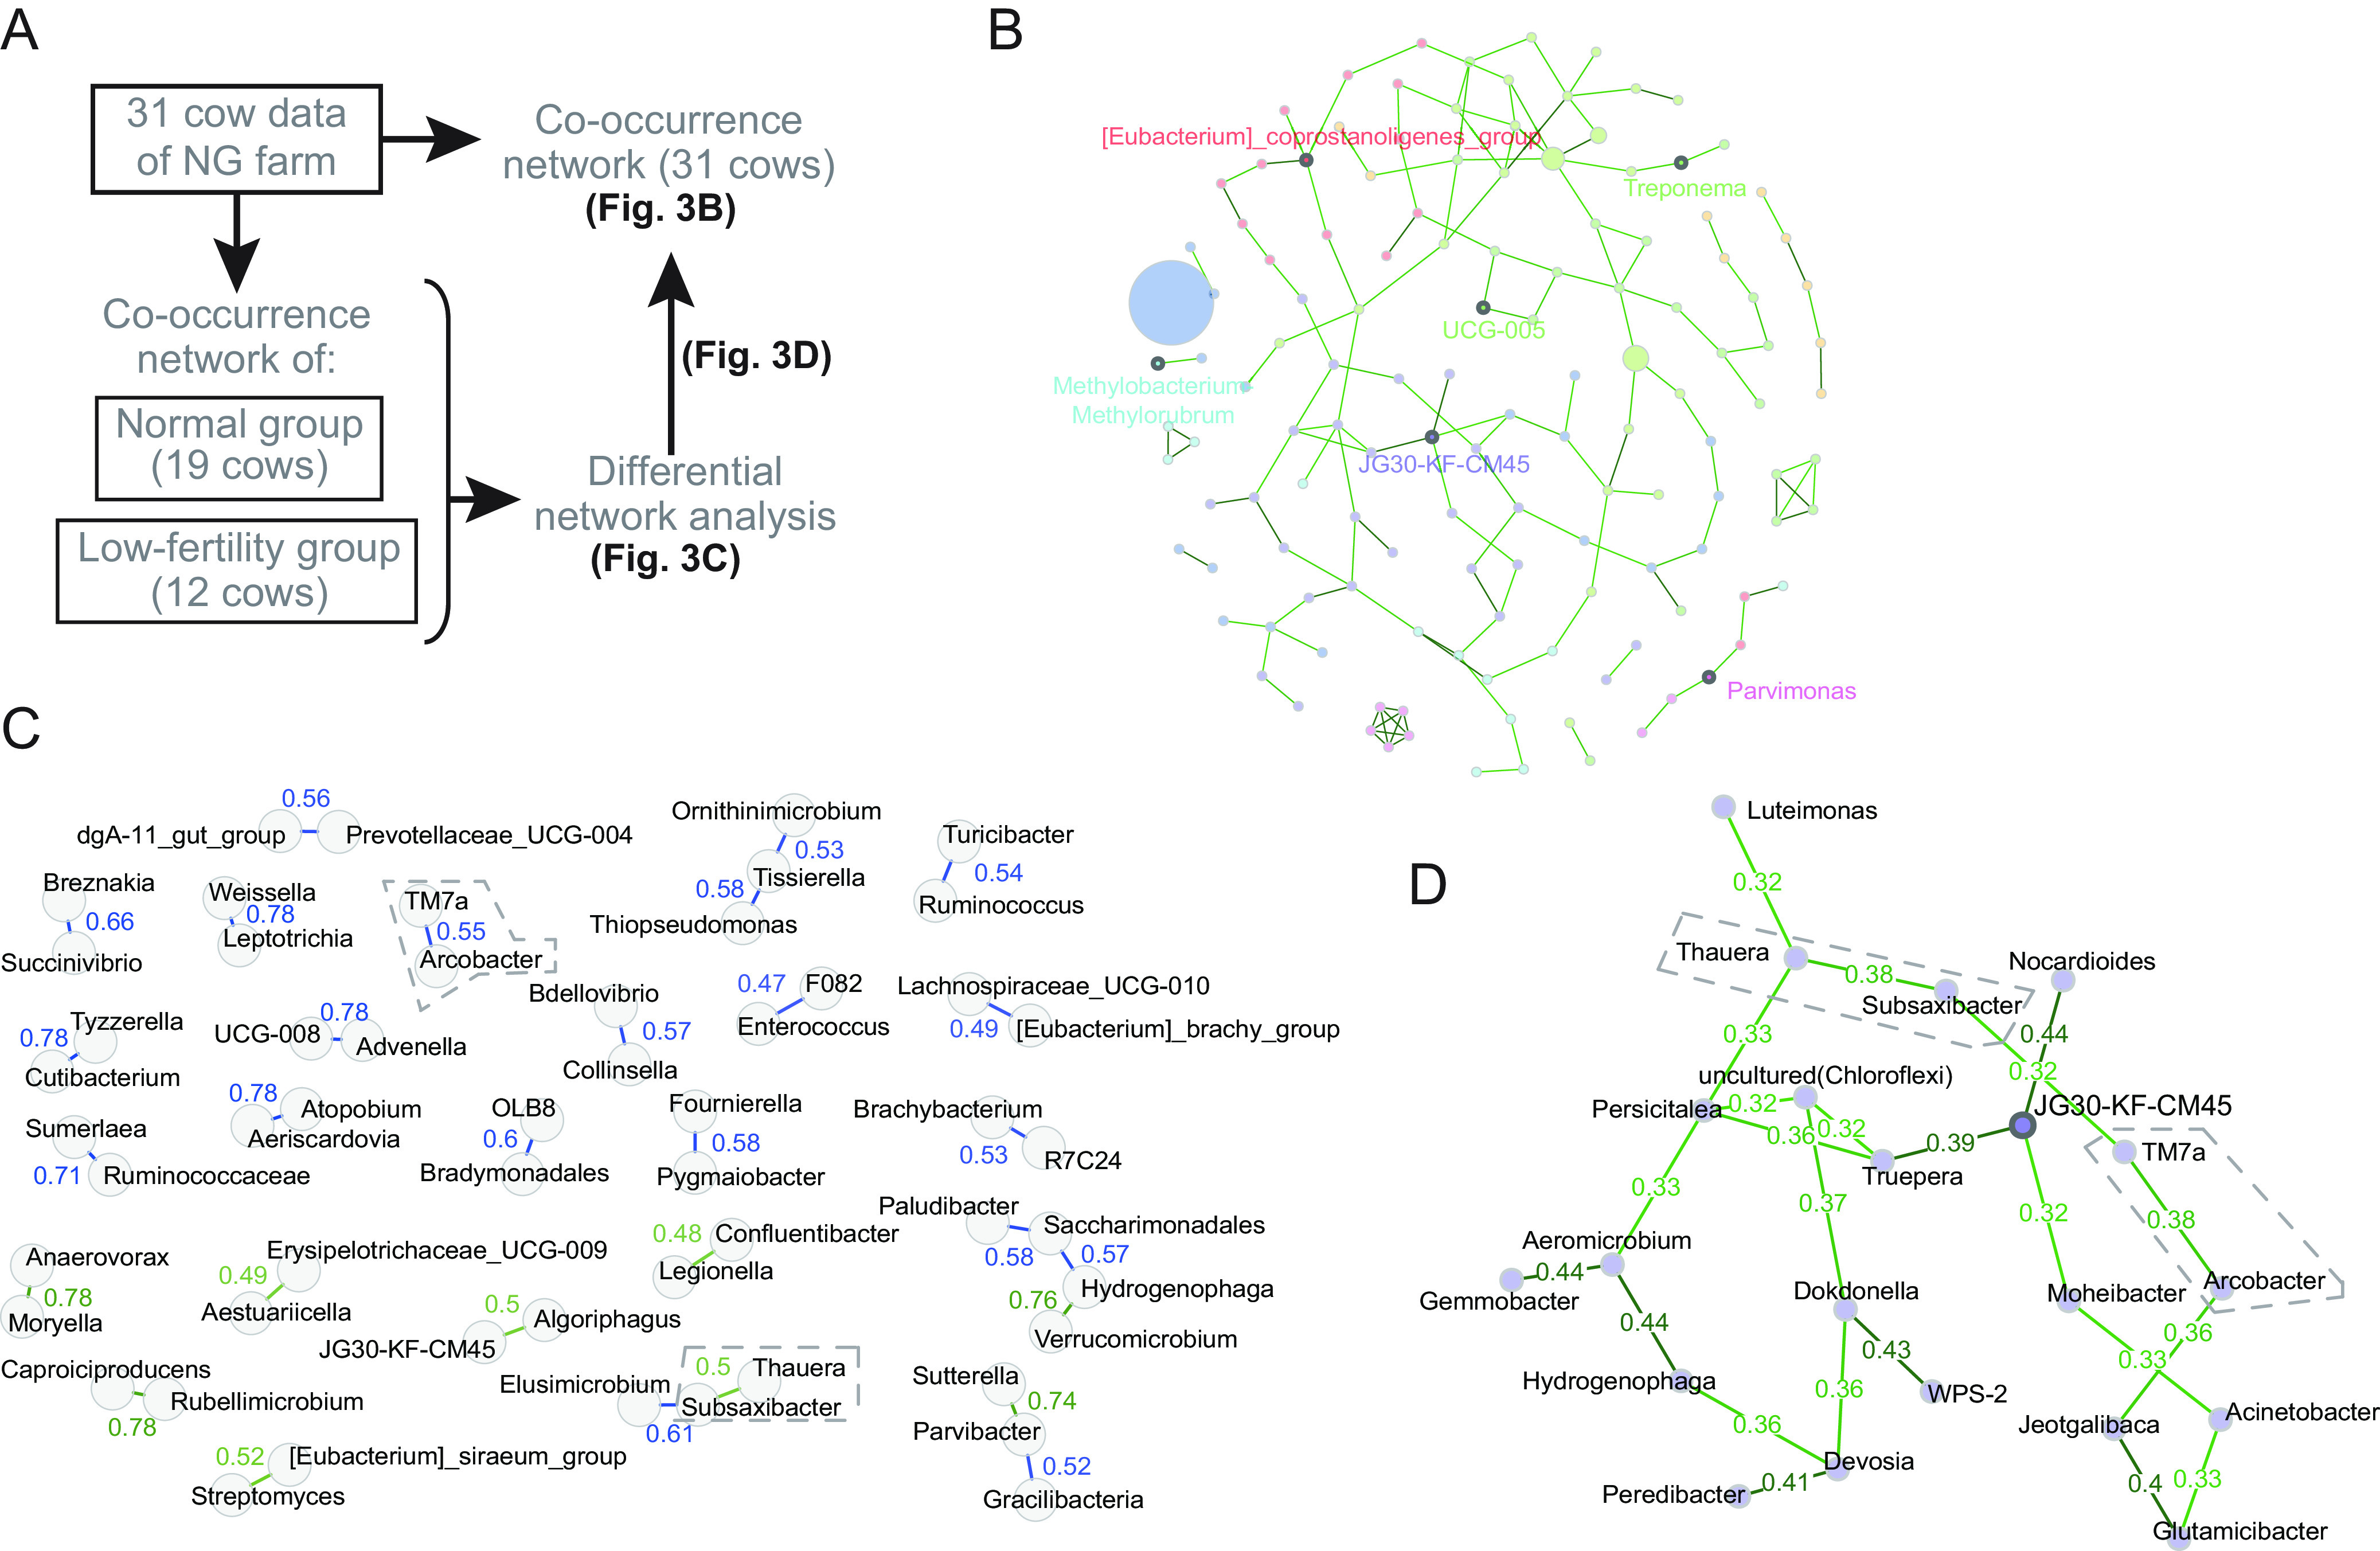
Assumption of bacterial associations by microbial co-occurrence network analysis in the NG farm. (A) Analysis procedure to assume the bacterial associations related to fertility. (B) Co-occurrence network of the uterus microbiota of all the cows in the farm. The node size represents the abundance of bacterial taxa. The numbers adjacent to the edges are the edge weights. Bold points with a name in the network represent the hubs calculated from the centralities. In the network, based on the network centralities, Eubacterium_coprostanoligene (order Oscillospirales), Methylobacterium-Methylorubrum (family Beijerinckiaceae), Parvimonas (order Peptostreptococcales-Tissierellales), JG30-KF-CM45 (order Thermomicrobiales), Treponema (family Spirochaetaceae), and UCG-005 (family Oscillospiraceae) were assumed to be hub bacteria. (C) Normal-group-preponderance and low-fertility-group-preponderance associations detected in a differential network. Thirty edges with the highest differences were extracted from the differential network analysis. Green and blue lines are normal-group-associated and low-fertility-group-associated edges, respectively. The edge weights are shown in numbers adjacent to the edges. (D) A cluster of co-occurrence network of the uterus microbiota, containing JG30-KF-CM45 as a hub. The cluster, which is a part of the co-occurrence network of the NG farm cows, contained the low-fertility-group-preponderance association of Arcobacter-TM7 and the normal-group-preponderance association of Thauera-Subsaxibacter, which are enclosed with dashed lines in panels C and D.