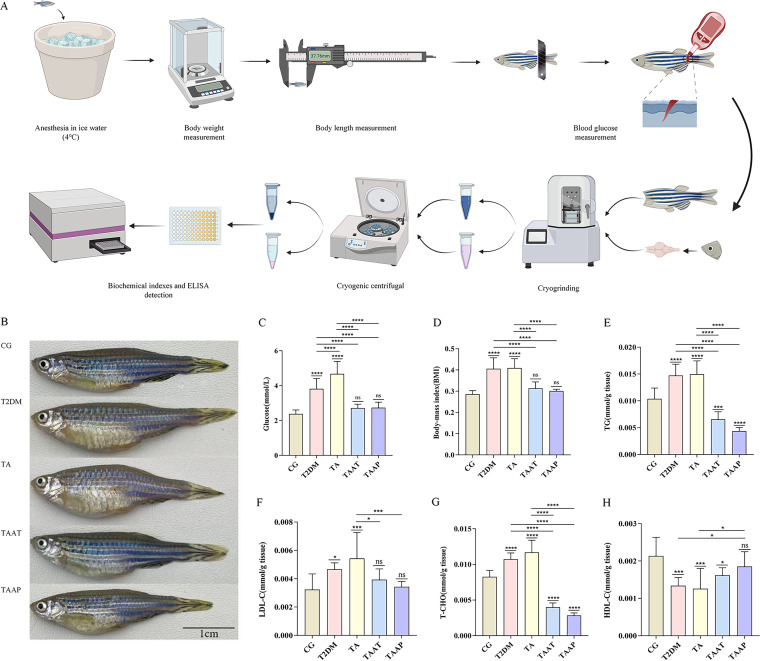
FIG 2.
Whole-body tissue examination in different groups of zebrafish. (A) Flow chart of blood glucose, BMI, and biochemical indexes of zebrafish; (B) morphology of zebrafish before and after treatment; (C) level of glucose (n = 20 per group); (D) BMI (n = 20 per group); (E) triglyceride (TG) (n = 10 per group); (F) low-density lipoprotein (LDL-C) (n = 10 per group); (G) total cholesterol (T-CHO) (n = 10 per group); (H) high-density lipoprotein cholesterol (HDL-C) (n = 10 per group). Data are expressed as the mean ± SEM and were analyzed by one-way analysis of variance (ANOVA), followed by Tukey's post hoc test. Significance was defined as follows versus control groups (n = 20 per group): *, P < 0.05; **, P < 0.01; ***, P < 0.001; and ****, P < 0.0001.

