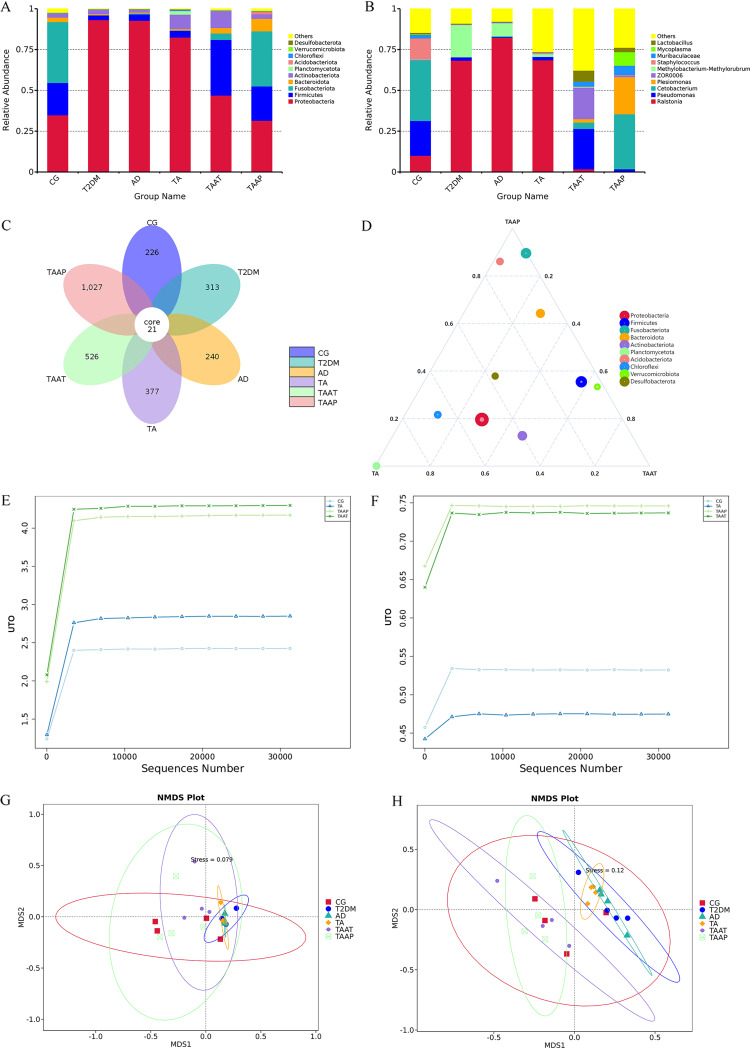
FIG 8.
Differential enrichment of intestinal microorganisms in different groups of zebrafish. Distribution of top 10 bacterial taxa averaged at the (A) phylum and (B) genus levels in gut from all groups; (C) flower graph based on operational taxonomic units in the zebrafish intestinal microbiota of all groups; (D) ternary plot graph illustrating the different bacterial species in intestinal samples. (E) The Shannon index was used to determine the community diversity of zebrafish intestines. (F) The Simpson index was used to characterize the diversity and evenness of species distribution in zebrafish intestinal community. (G and H) Weighted and unweighted nonmetric multidimensional scaling (NMDS) was used to measure zebrafish intestinal bacterial composition profile treatment.

