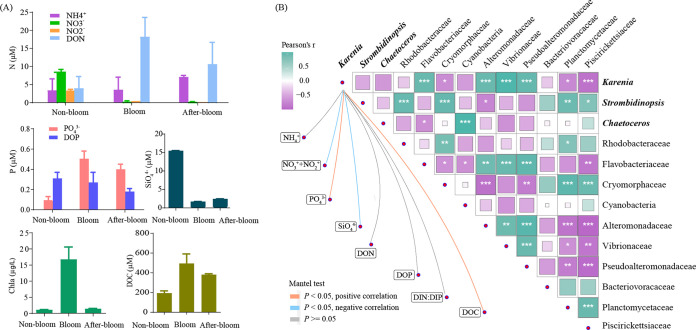
FIG 2.
Quantitative relationships of lineages within the community with nutrient variables. (A) Changes of nutrient concentrations, chlorophyll, and dissolved organic carbon concentrations with bloom conditions. (B) Correlations of dominant lineages with each other and with nutrient conditions. Correlations between lineages (filled squares) were analyzed using the Pearson test. Deeper color and larger squares mark stronger correlations. *, P = 0.01 to 0.05; **, P < 0.01; ***, P < 0.001. Correlations between Karenia and nutrient factors (connecting lines) were analyzed using the Mantel test. The orange and blue connecting lines mark positive and negative correlations between the relative abundance levels of Karenia and nutrient concentrations.

