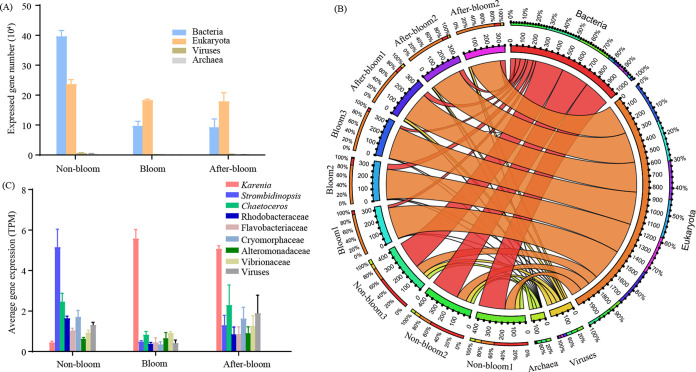
FIG 3.
Community metabolic profiles based on community TPM in the three bloom stages. (A) Expressed gene diversity in the four kingdoms. The average gene diversity of three biological replicates is displayed for each group. (B) Circos plot summarizing gene expression (TPM) contribution of the four kingdoms to each sample. The different colors of the inner ring mark total TPM of different samples or kingdoms. The outer ring shows the gene expression percentages of kingdoms in samples or gene expression percentages of samples in kingdoms, with colors corresponding to the inner ring. Wider connecting ribbons between kingdom and sample indicate a larger gene expression contribution of this kingdom in the sample. (C) Average gene expression level (total TPM divided by number of genes with read count of >0) in the dominant lineages.

