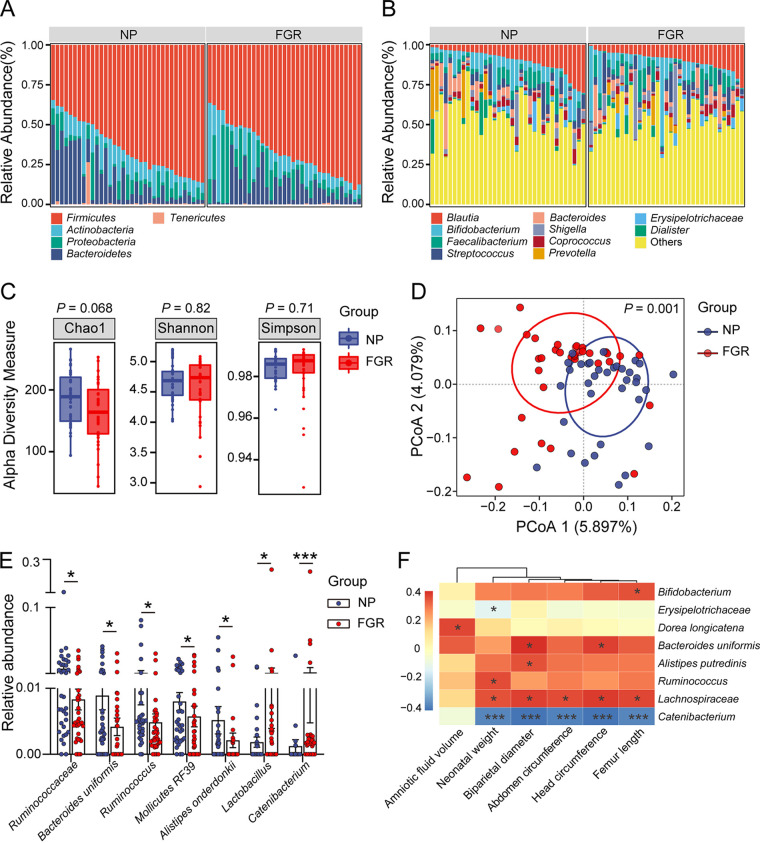
FIG 1.
Gut microbiota profile of patients with FGR and normal pregnant women. (A) Component proportion of bacteria at phyla level in the two groups. (B) The composition of bacteria at species level. (C) α-Diversity of the two group. (D) β-Diversity based on unweighted UniFrac distances. (E) The relative abundances of significantly differentially abundant gut bacteria between the two groups. The P value was adjusted with FDR. (F) Correlation heatmap between fetal measurements and the abundant bacterial species. Data were presented as median and interquartile range (IQR) in panels C and E, and Wilcoxon rank-sum test was used for statistical analysis. Spearman’s correlation test was used for statistical analysis. *, P < 0.05; **, P < 0.01; ***, P < 0.001. NP, n = 35; FGR, n = 35.

