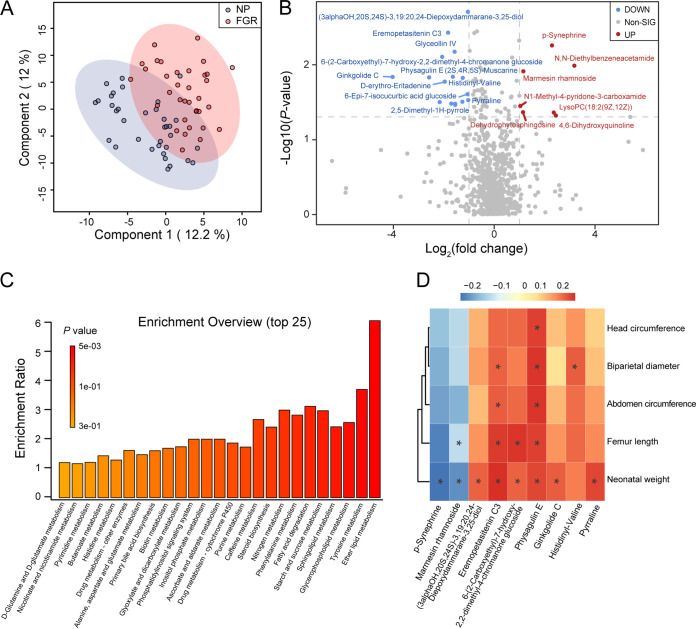
FIG 2.
Fecal metabolome profile of patients with FGR and normal pregnant women. (A) PLS-DA analysis of the two groups. (B) The volcano plot of core metabolites, blue for downregulated and red for upregulated in FGR group. (Fold change > 2 and P < 0.05). (C) Enriched KEGG pathways involved in FGR group. (D) Correlation heatmap between fetal measurements and the core differential metabolites. Data were processed by Spearman’s correlation test. *, P < 0.05; **, P < 0.01; ***, P < 0.001. NP, n = 35; FGR, n = 35.

