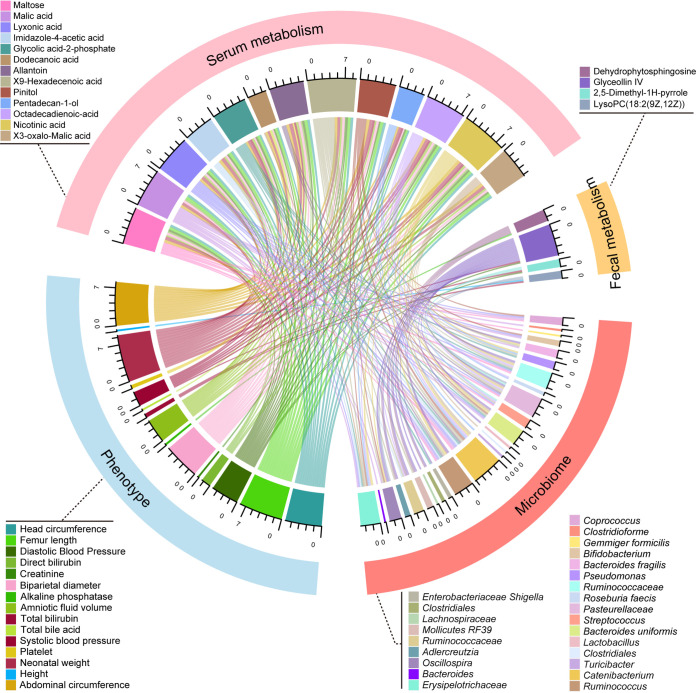
FIG 4.
Multi-omics analysis of the altered gut microbiota, fecal and serum metabolites, and maternal-fetal phenotypes. The chord plot showed the pairwise relationships among microbiome, fecal metabolism, serum metabolism, and phenotypes. Correlation tests on all participants for microbiome, fecal metabolism, and phenotypes were performed. As for serum metabolism, corresponding phenotypes and microbiome data were involved in the correlation analysis. Vertices with different colors indicate omics variables, and lines indicate a significant Spearman correlation coefficient at |r| > 0.3 and padj < 0.05. Scales show the sum of correlation coefficients for each variable.

