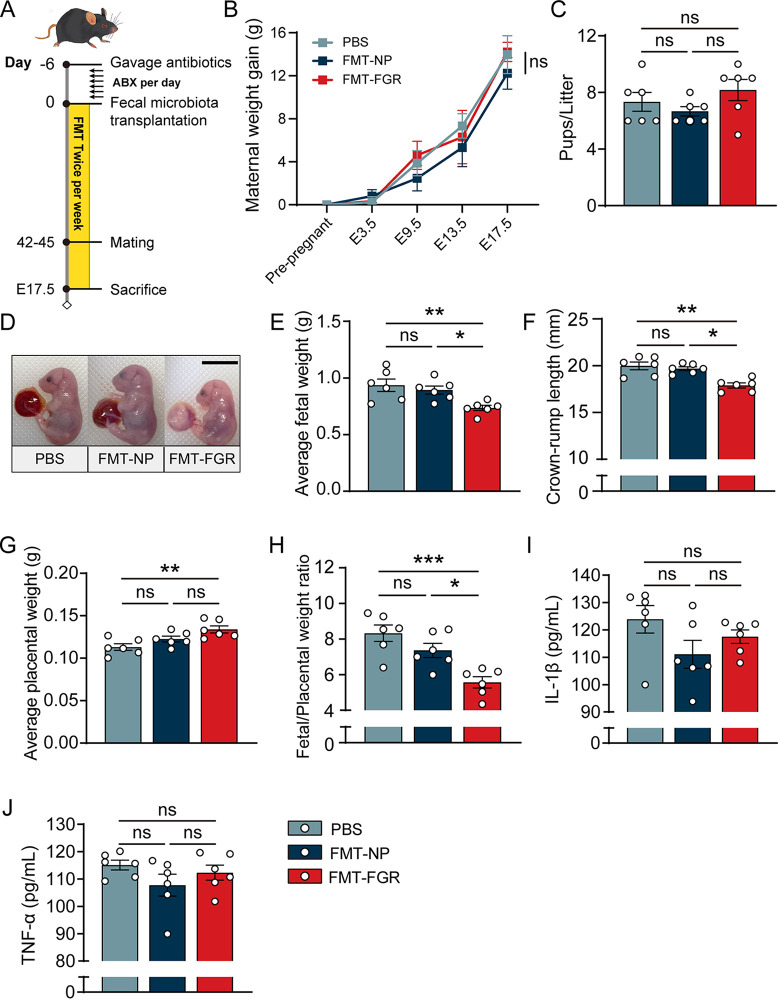
FIG 6.
FMT induced FGR phenotypes. (A) Overall timeline of the mouse experiment. (B) Maternal weight gain of each group. (C) Pups/litter of each group. (D) Representative fetus photo of each group. (E) Average fetal weight. (F) Average fetal crown-rump length. (G) Average placental weight. (H) Placental efficiency, calculated as grams fetus/grams placenta. (I) Serum IL-1β level. (J) Serum TNF-α level. For fetal weight, crown-rump length, and placental weight, analyses were performed by taking the average of weights and measurements by litter (5 pups/litter, n = 6/group). Data in panel B were presented in mean ± standard deviation (SD) and processed by two-way ANOVA. Data in panels C and E to J were presented as mean ± standard error of the mean (SEM) based on normality tests, and a one-way ANOVA test was conducted followed by a Bonferroni test. *, P < 0.05; **, P < 0.01; ***, P < 0.001. n = 6/group.

