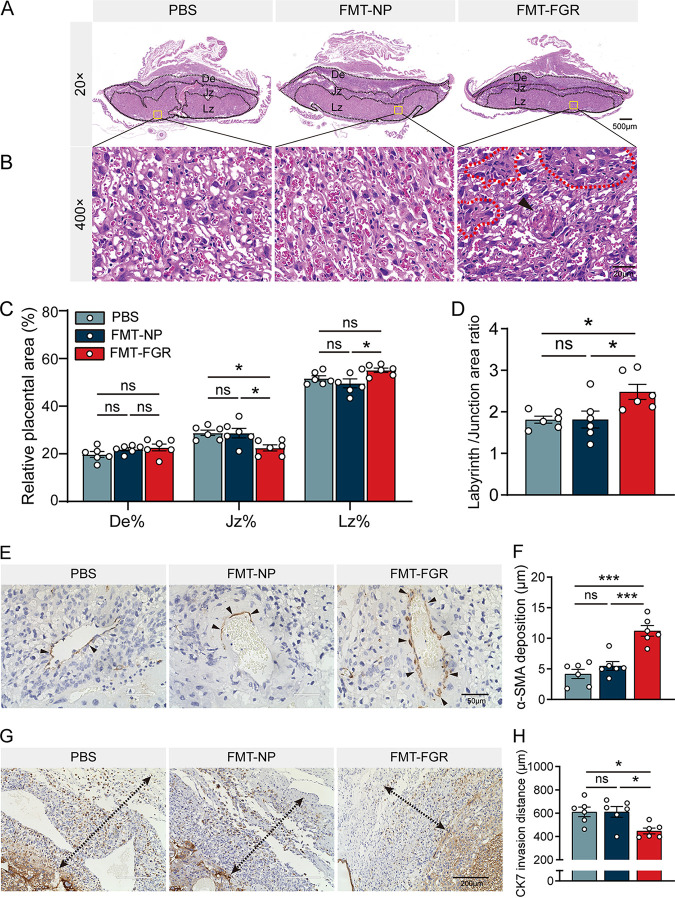
FIG 7.
FMT induced placental impairments. (A) Representative images of H&E staining midsagittal placental sections. De, Jz, and Lz areas were marked (magnification, ×20; scale bar = 500 μm). (B) Representative images of H&E staining of the Lz (magnification, ×400; scale bar = 20 μm). The arrowhead indicates the infarction lesion in the Lz, and the dotted lines indicate swollen tissues and restricted maternal sinusoidal blood space. (C) The areas of De, Jz, and Lz were expressed as the percentage of the total placental area. (D) The ratio between the Lz/Jz. (E) Representative images of α-SMA immunohistochemistry staining (scale bar = 50 μm). The arrowheads denote α-SMA-positive cells. (F) Quantification of α-SMA-positive cells surrounding decidual spiral arteries. (G) Representative images of CK-7 immunohistochemistry staining. The dotted lines with arrowheads show the invasive depth of CK-7-positive cells into the De (scale bar = 200 μm). (H) Maximum distance of CK-7-positive cell invasion into the De (n = 6/group). Data were presented as mean ± SEM and processed by one-way ANOVA. *, P < 0.05; **, P < 0.01; ***, P < 0.001. n = 6/group. FMT, fecal microbiota transplantation; De, decidua; Jz, junctional zone; Lz, labyrinth zone; α-SMA, alpha-smooth muscle actin; CK-7, cytokeratin-7; ns, not significant.

