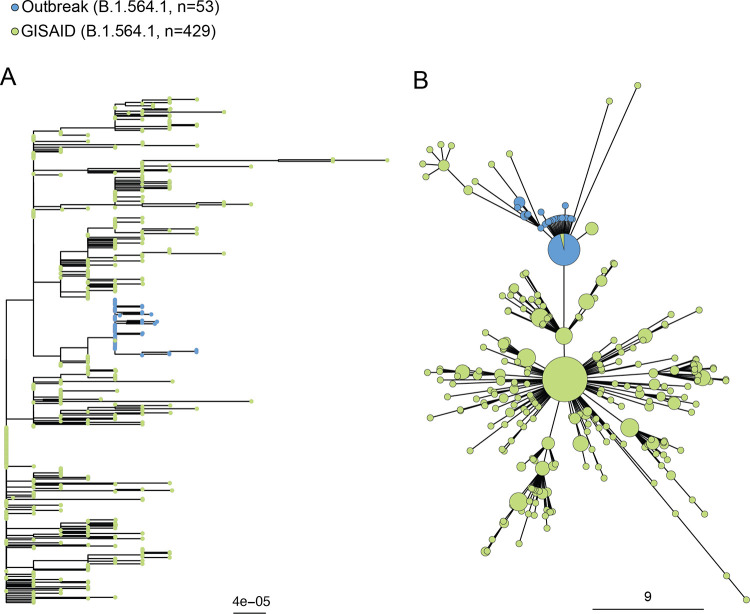
FIG 3.
Phylogenetic tree (A) and minimum spanning tree (B) with the scales in nucleotide distances of outbreak samples and Canadian SARS-CoV-2 B.1.564.1 sequences from GISAID. Sequences from GISAID are shown in green, whereas sequences from the outbreak are shown in blue. The size of the circle in the minimum spanning tree is proportional to the number of sequences.

