FIG 4.
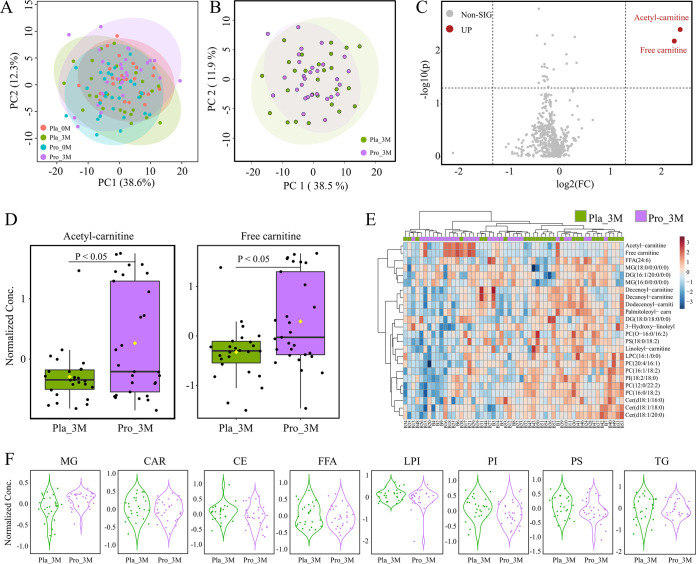
Changes in serum lipid profile after Probio-X intervention. (A and B) Principal-component analysis of serum lipid metabolomes of subjects. Each dot represents the serum lipid metabolome of each subject. (C) Volcano map showing detected serum lipid metabolites. Non-SIG represented metabolites without significant increase after probiotic intervention, UP represented metabolites with significant increase after probiotic intervention. Significantly increased metabolites are shown in red. (D) Relative abundance heatmap of differential metabolites. The color scale represents the relative abundance of metabolites. (E) Box plots showing the normalized amounts of acetyl-carnitine and free carnitine after probiotic intervention. (F) Violin plots showing differences in various lipid metabolites after probiotic intervention. G, monoglyceride; CAR, acyl carnitine; CE, cholesterol lipids; FFA, free fatty acids; LPI, lysophosphatidylinositol; PI, phosphatidylinositol; PS, phosphatidyl serine. Pla_0M and Pla_3M indicate before and 3 months after the placebo intervention, respectively, and Pro_0M and Pro_3M before and 3 months after the probiotic intervention, respectively.

