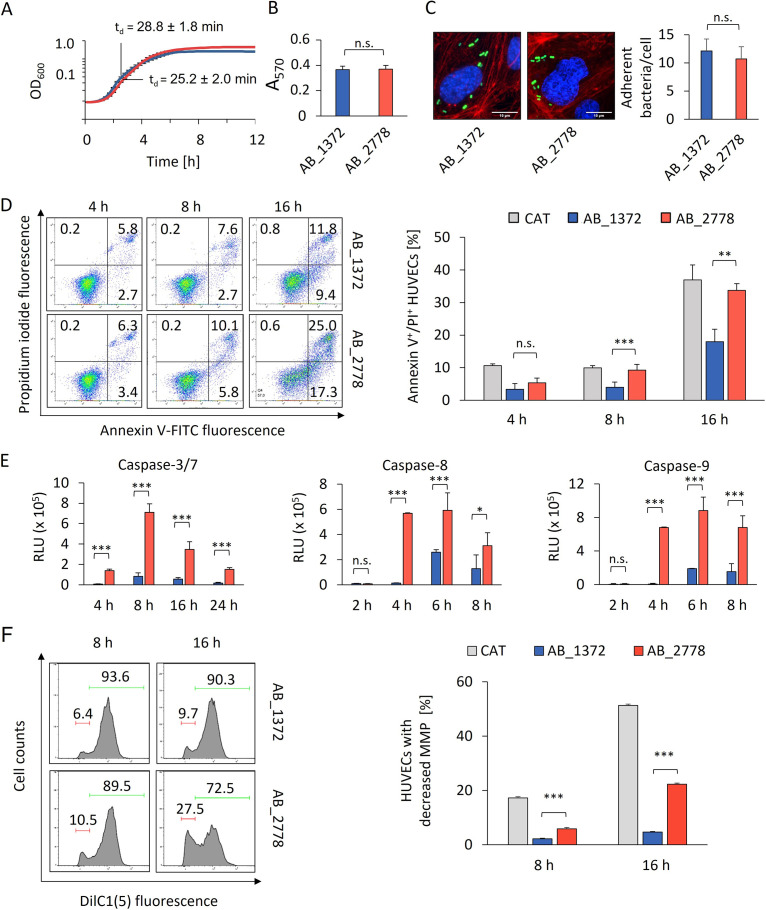
FIG 2.
Virulence traits of AB_2778 and AB_1372. (A) Growth analysis of AB_1372 and AB_2778. (B) Biofilm formation of AB_1372 and AB_2778 was quantified by crystal violet staining. (C) Adhesion of AB_1372 and AB_2778 to HUVECs. Fluorescence microscopy of infected HUVECs shows cytoskeleton (red, TRITC-phalloidin), DNA (blue, DAPI), and AB_1372 and AB_2778 (green, carboxyfluorescein succinimidyl ester [CFSE]). (D) Analysis of induction of apoptosis in HUVECs upon infection by propidium iodide/annexin V-FITC staining and flow cytometry. (E) Caspase activation by AB_1372 and AB_2778 in HUVECs as determined by the fluorometric caspase-Glo assay. Values are specified in relative luminescence units (RLU). (F) Analysis of mitochondrial membrane depolarization of HUVECs infected with AB_1372 or AB_2778 for the indicated times. HUVECs were stained with the mitochondrial membrane potential (MMP)-dependent dye DilC1(5). (Left) In the representative fluorescence-activated cell sorting (FACS) plots, the red bars indicate the percentage of HUVECs with mitochondrial membrane depolarization. The green bars indicate the percentage of HUVECs with a stable MMP. (Right) Percentages of cells with depolarized mitochondrial membrane are shown. All data are derived from at least three independent experiments. Values are means ± SD. Statistical analysis was performed by a two-tailed t test. *, P < 0.05; **, P < 0.01; ***, P < 0.005 (A to F). OD, optical density; n.s., not significant.

