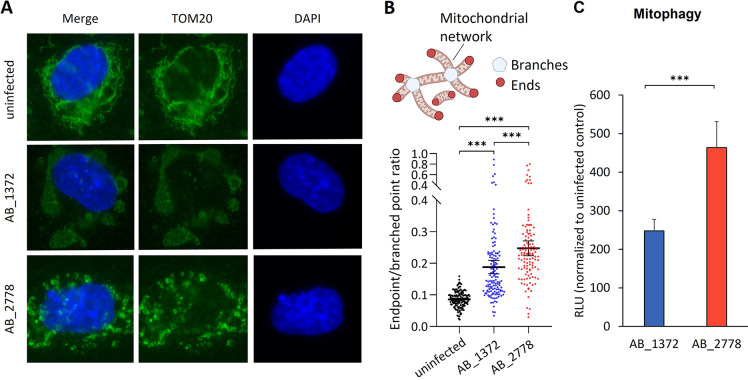
FIG 6.
Changes in morphology and metabolic adaptation of mitochondria upon infection with AB_1372 and AB_2778. (A) Representative image of fluorescence microscopy of uninfected and infected HUVECs. DAPI staining was used for visualization of DNA. The outer mitochondrial membrane protein TOM20 was stained in an immunofluorescence assay, and mitochondrial morphology and dynamics were monitored. (B) Quantification of the mitochondrial endpoint/branched point ratio (EBR) in HUVECs infected with A. baumannii AB_1372 or AB_2778 for 16 h in comparison to uninfected cells. EBR is defined as the sum of all endpoints divided by the sum of all branched points (32, 33). Data are presented as means with 95% confidence intervals from approximately 150 cells quantified for each condition (n = 3). Statistical analyses were performed using a Kruskal-Wallis test with Dunn’s multiple-comparison test. Values are means ± 95% confidence intervals. (C) Mitophagy was determined by fluorometry using the Dojindo mitophagy detection kit. Values are means ± SEM (n = 3). Statistical analysis was performed by a two-tailed t test. ***, P < 0.005.

