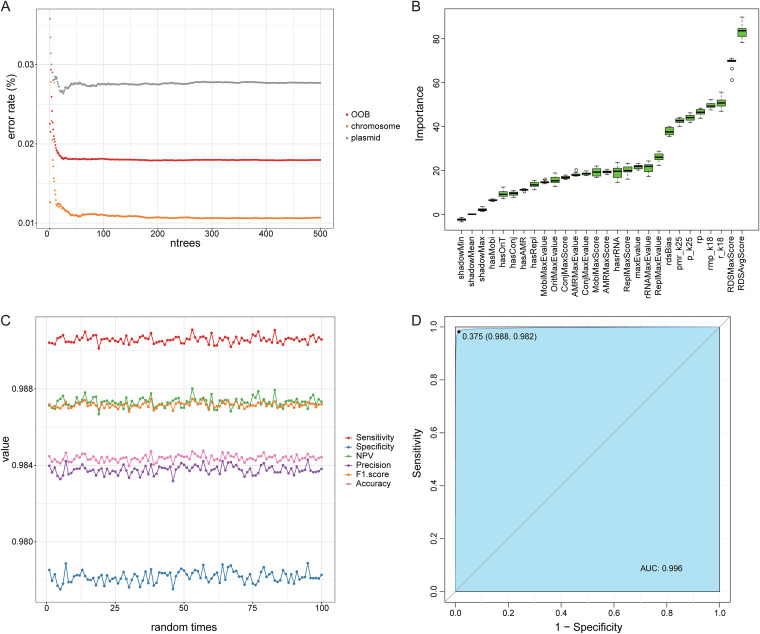
FIG 1.
The performance of the classified model based on random forest analysis. (A) The estimation of the number of trees in the model. The x axis represents the number of trees in the model; the y axis represents the error rate of the model. OOB, out of bag. (B) The importance of all features. The x axis represents all the features; the y axis represents the importance. Green means the feature is important for classifying. (C) The performance indicators of the model during 100 random time points. Different colors represent different indicators. (D) The ROC curve of the model. The x axis represents 1 specificity; the y axis represents the sensitivity. The area under the curve (AUC) is 0.996.

