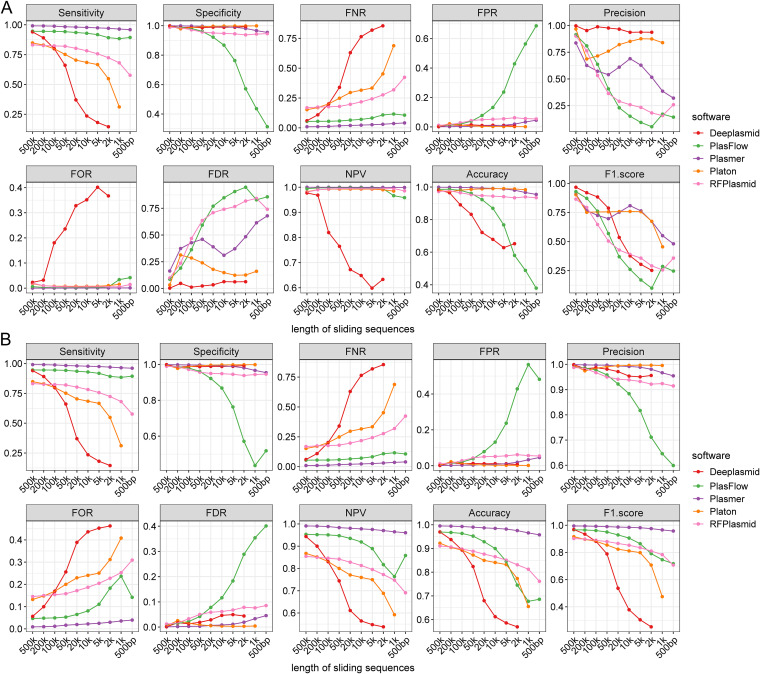
FIG 2.
The performance of Plasmer and other methods for the remaining sliding sequences with different lengths of 31,897 complete bacterial genomes in NCBI. Each subpanel represents one indicator, such as sensitivity. The x axis represents lengths of the sequences; the y axis represents the values of indicators. Different colors represent different indicators. (A) The performance on all remaining sliding sequences. (B) The performance on resampled sliding sequences with balanced numbers of chromosomes and plasmids.

