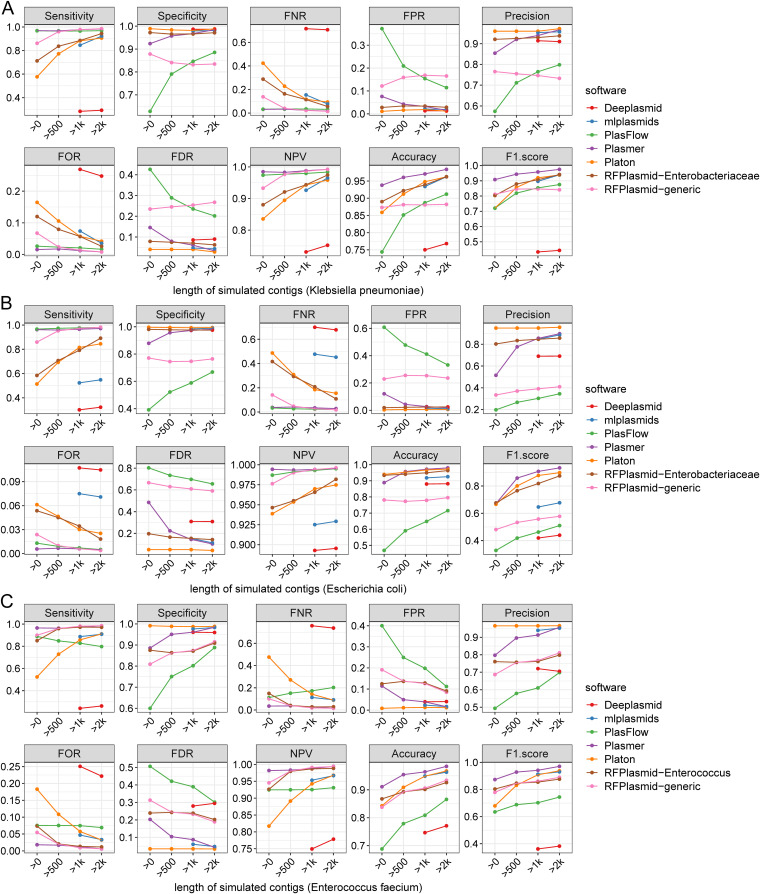
FIG 3.
The performance of Plasmer and other methods for contigs assembled by simulated reads of Klebsiella pneumoniae, Escherichia coli, and Enterococcus faecium. Each subpanel represents one indicator, such as sensitivity. The x axis represents the lengths of the sequences; the y axis represents the values of indicators. Different colors represent different indicators. (A) The 552 complete genomes of Klebsiella pneumoniae. (B) The 1,718 complete genomes of Escherichia coli. (C) The 123 complete genomes of Enterococcus faecium.

