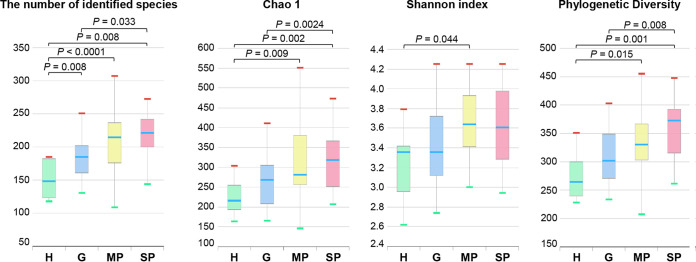
FIG 1.
Comparison of the numbers of identified species, Chao1 indices, Shannon indices, and phylogenetic diversities. Saliva samples were collected from 8 periodontally healthy subjects (H group), 16 patients with gingivitis, 19 patients with moderate periodontitis (MP group), and 29 patients with severe periodontitis (SP group). Each value is presented as a box plot. The top, middle, and bottom lines of the boxes represent the 25th, 50th (median), and 75th percentiles, respectively. The significance of each difference among the four groups was evaluated using the Wilcoxon rank sum test, and a P value of <0.05 was considered to indicate statistical significance. Only P values of <0.05 are indicated.

