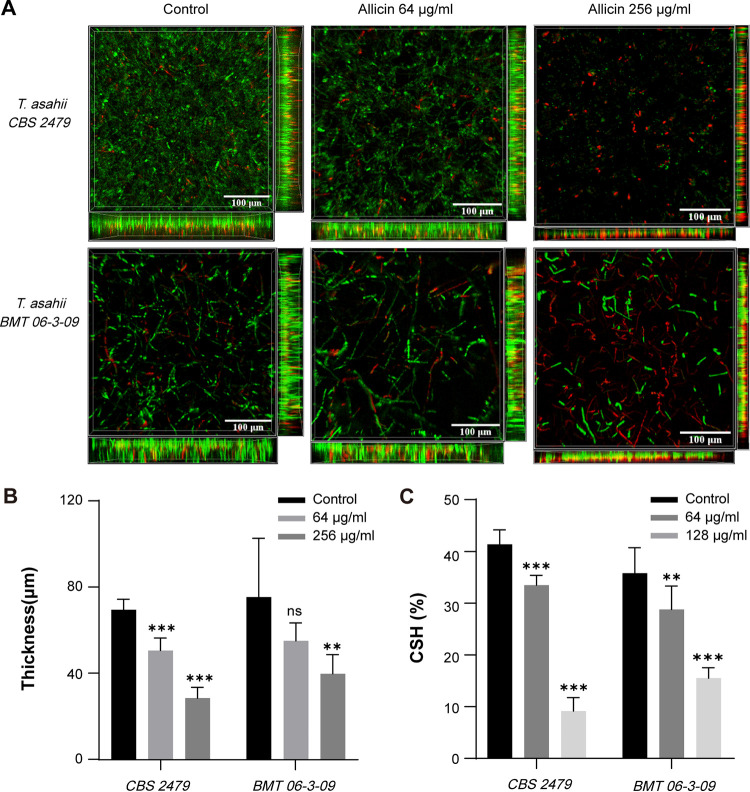
FIG 3.
(A) CLSM images of T. asahii biofilms following treatment with allicin. SYTO 9 shows live cells (green), and PI shows dead or damaged cells (red). Magnification, ×400. (B) Quantitative analysis of biofilm thickness in CLSM images. (C) Effect of allicin on cell surface hydrophobicity of T. asahii (n = 3).

