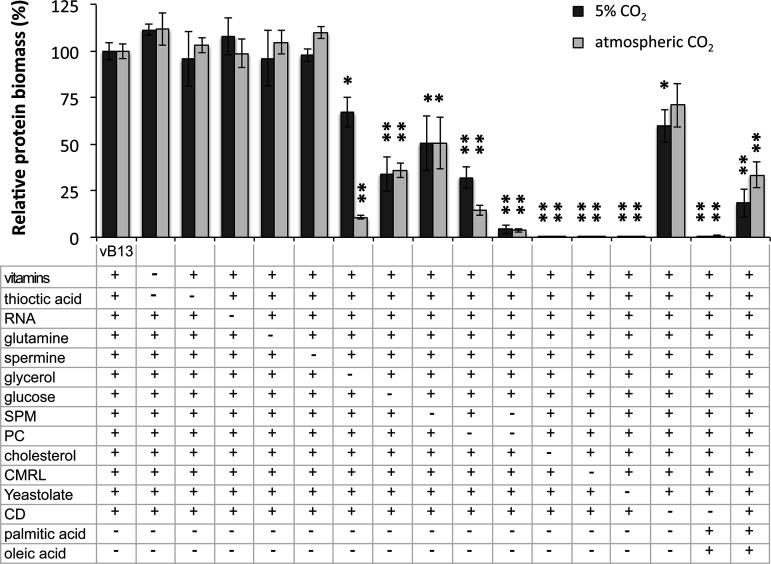
FIG 2.
Contribution of specific compounds in vB13 growth performance. Data show the percentage of protein biomass in the absence or presence of specific compounds (as indicated below the bar plot) relative to vB13 formulation. Cultures were grown in a 96-well-plate format and processed after 96 h of culture in 5% CO2 or in atmospheric CO2 conditions. The plus (+) symbol represents the presence of the compound, while the minus (−) symbol represents its absence. Data represent the mean ± standard error of at least 3 independent biological replicates for each medium and condition. Significance relative to the vB13 formulation was assessed by two-sided independent t test (*, P < 0.05; **, P < 0.005).

