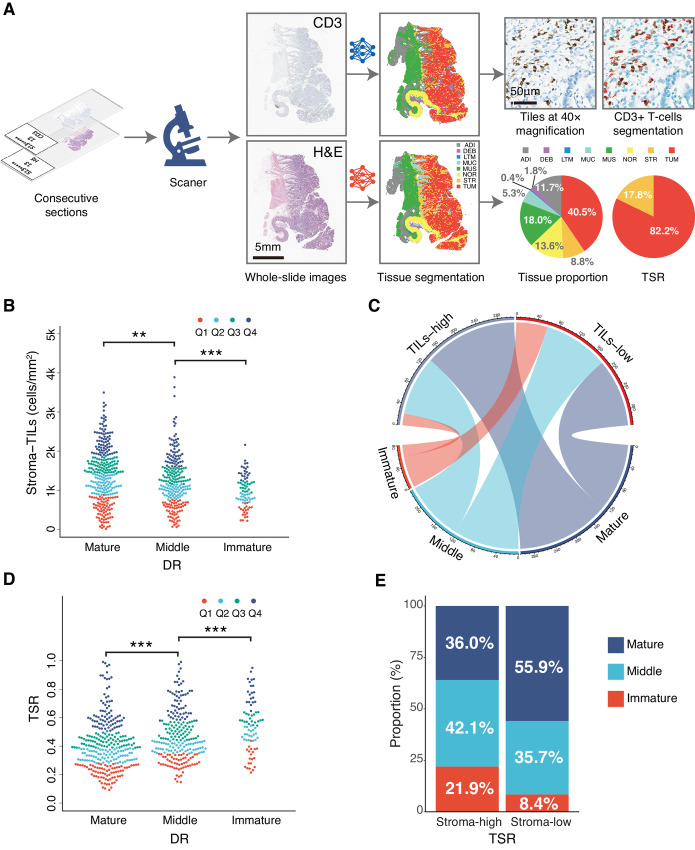
FIGURE 4.
Correlation between DR and TILs, tumor stroma ratio. A, The workflow of TILs within stroma and TSR quantification. B and C, The correlation between DR and TILS within stroma. D and E, The correlation between DR and TSR. DR, desmoplastic reaction; TILs, tumor-infiltrating lymphocytes; TSR, tumor stroma ratio (Note: The P values of multiple comparisons in B and D were adjusted with Benjamini–Hochberg correction.).

