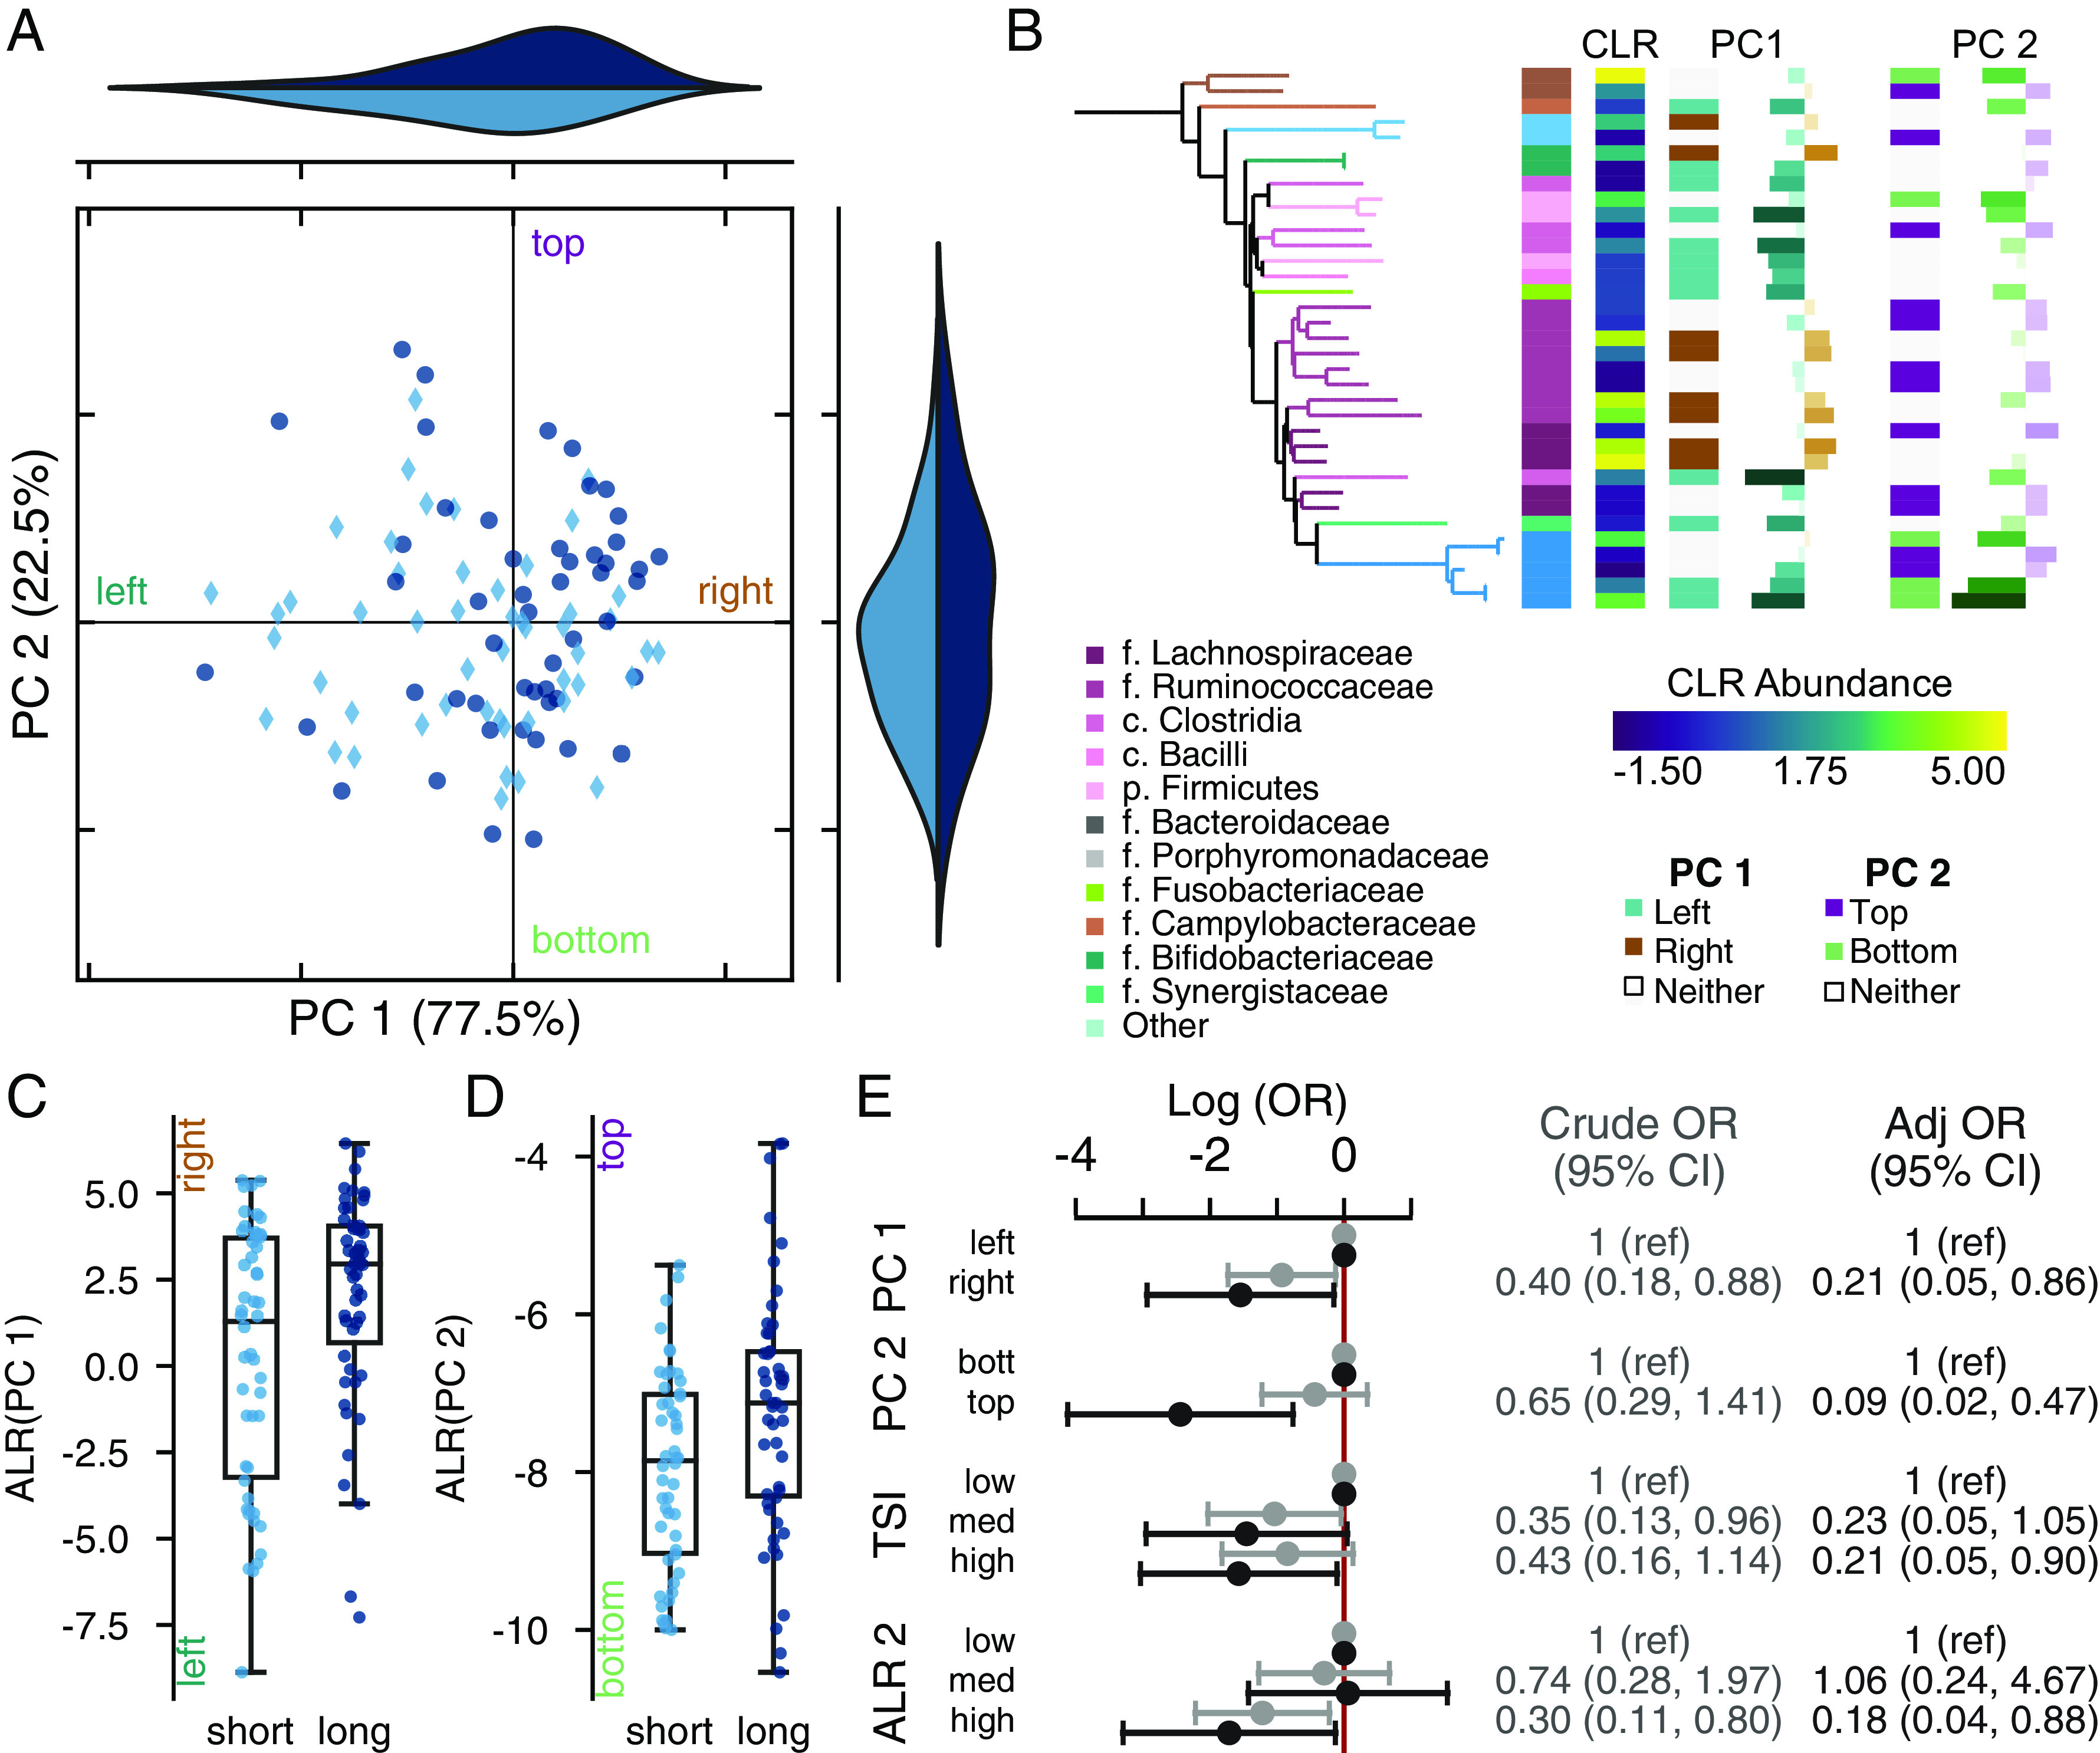
FIG 3.

The tumor-associated microbiome is associated with survival. (A) Robust principal component analysis (rPCA) ordination as indicated by short-term (light) or long-term (dark) survival. Marginal axes show the distribution of points along each PC. The ordination is centered at the median distribution of points in each axis. (B) Phylogenetic tree showing the ASVs with PC 1. The tips and first heatmap colors indicate taxonomic information. Heatmaps from left to right show the taxonomic assignment, the mean central log ratio (CLR) relative abundance (viridis), the mean difference in CLR between long- and short-term survivors; whether the feature was used in the additive log ratio (ALR) calculation for PC 1 (teal, left; brown, right); the feature loading along PC 1; whether the feature was used in the PC 2 ALR calculation (green, bottom; purple, top); and the feature loadings along PC 2, coordinates to the top on the left. (C and D) Boxplot of the ALR of most extreme ranked taxa along selected based on PC 1 (C) and PC 2 (D). Axes are labeled to indicate the directionality of the log ratio calculation; the label colors matchthose in panel B. (E) Log odds of short survival based on separation along the median of the PCs or grouping in the ALR shown in light gray values are crude; those in dark gray are adjusted for age, sex, surgery year, tumor location, ASA score, differentiation grade, and TNM stage. PC weights are adjusted for the position along the other PC; ALRs are not coadjusted.
