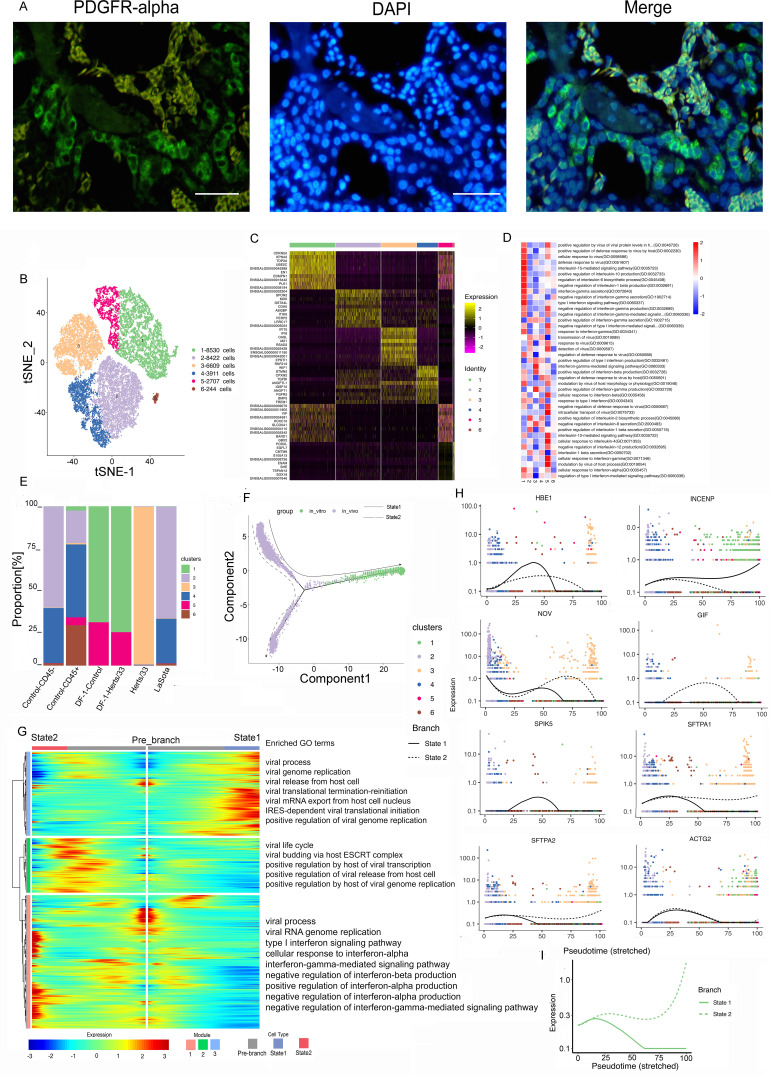
FIG 2.
Fibroblast cell clusters in the lungs and the DF-1 cell line. (A) Immunostaining of PDGFR in the lungs. Scale bars, 20 μm. (B) t-SNE plot of 30,423 fibroblast cells color-coded by their associated clusters. (C) Heatmap of the expression of the top 10 DEGs in each cell cluster. (D) Differences in pathway activities scored per cell by GSVA between the different fibroblast clusters, with enriched GO terms (P < 0.05). (E) Bar plots showing the proportion of each cluster both in vitro and in vivo in the control, Herts/33, LaSota, DF-1–control, and DF-1–Herts/33 groups. (F) Pseudotime trajectory plot representing NDV infection features both in vitro and in vivo. The solid line indicates features in vitro, and the dotted line indicates features in vivo. (G) Gene expression dynamics model along in vitro and in vivo lineages. (H) Expression patterns of the top 10 most dynamic genes in two states over pseudotime. (I) Dynamics of the IFN responses in two states over pseudotime.

