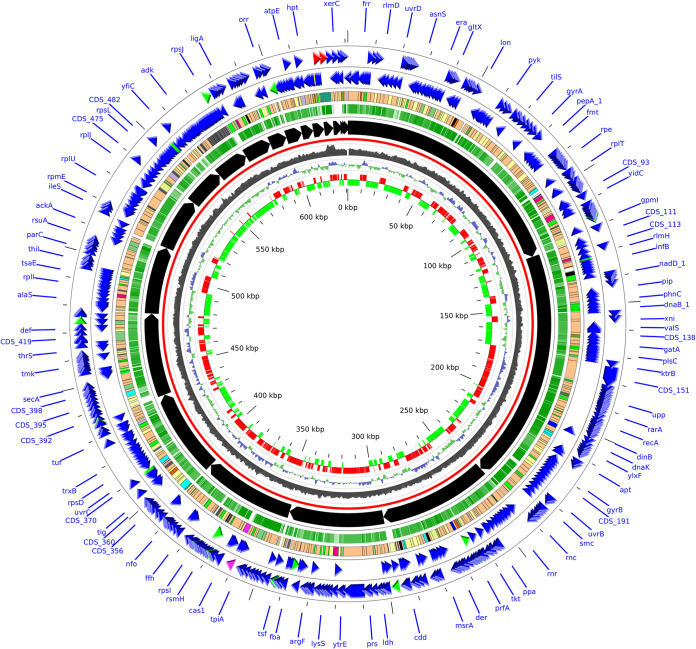
FIG 1.
Circular plot of the draft genome of the M. arginini strain isolated from the fly gut. The 21 annotated scaffolds sum up to 631,023 bp. Each circle represents a feature of the genome: from the innermost circle, we represented: gene strand (red: positive, green: negative), the GC skew, the GC content, reference backbone (in red), scaffolds (ordered by decreasing length), the percentage of identity with M. arginini HAZ145 reference strain (opacity is proportional to % identity), CDS (colored by type; among them, light orange: enzymes, light yellow: hypothetical proteins), CDS on negative and positive strands (colors indicate: blue: proteins, red: rRNA, green: tRNA).

