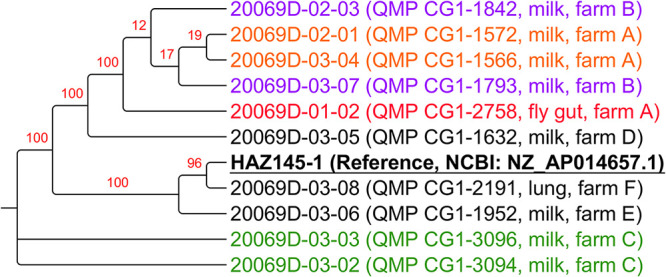
FIG 3.

Maximum likelihood phylogenetic tree obtained creating an artificial sequence made up of 76 conserved genes among the 10 newly sequenced M. arginini strains and the HAZ145 reference genome. Values from 100 bootstraps are indicated in red over the branches. Bootstrap values indicate how many times the same branch is observed when repeating the generation of a phylogenetic tree on a resampled set of data made by artificial sequences of randomly selected sites of the original sequences with replacement; this produces a different composition of the data with the same sequence length as the original data sets. For the newly sequenced strains, the farm and source of isolation is indicated; colors in the plot help highlighting isolates from the same farms: red = fly gut strain; orange = milk-isolated strains from the same farm as the fly gut one (i.e., farm A); Green, purple = paired strains from the same farm. The HAZ145 reference sequence is highlighted in bold and underlined.
