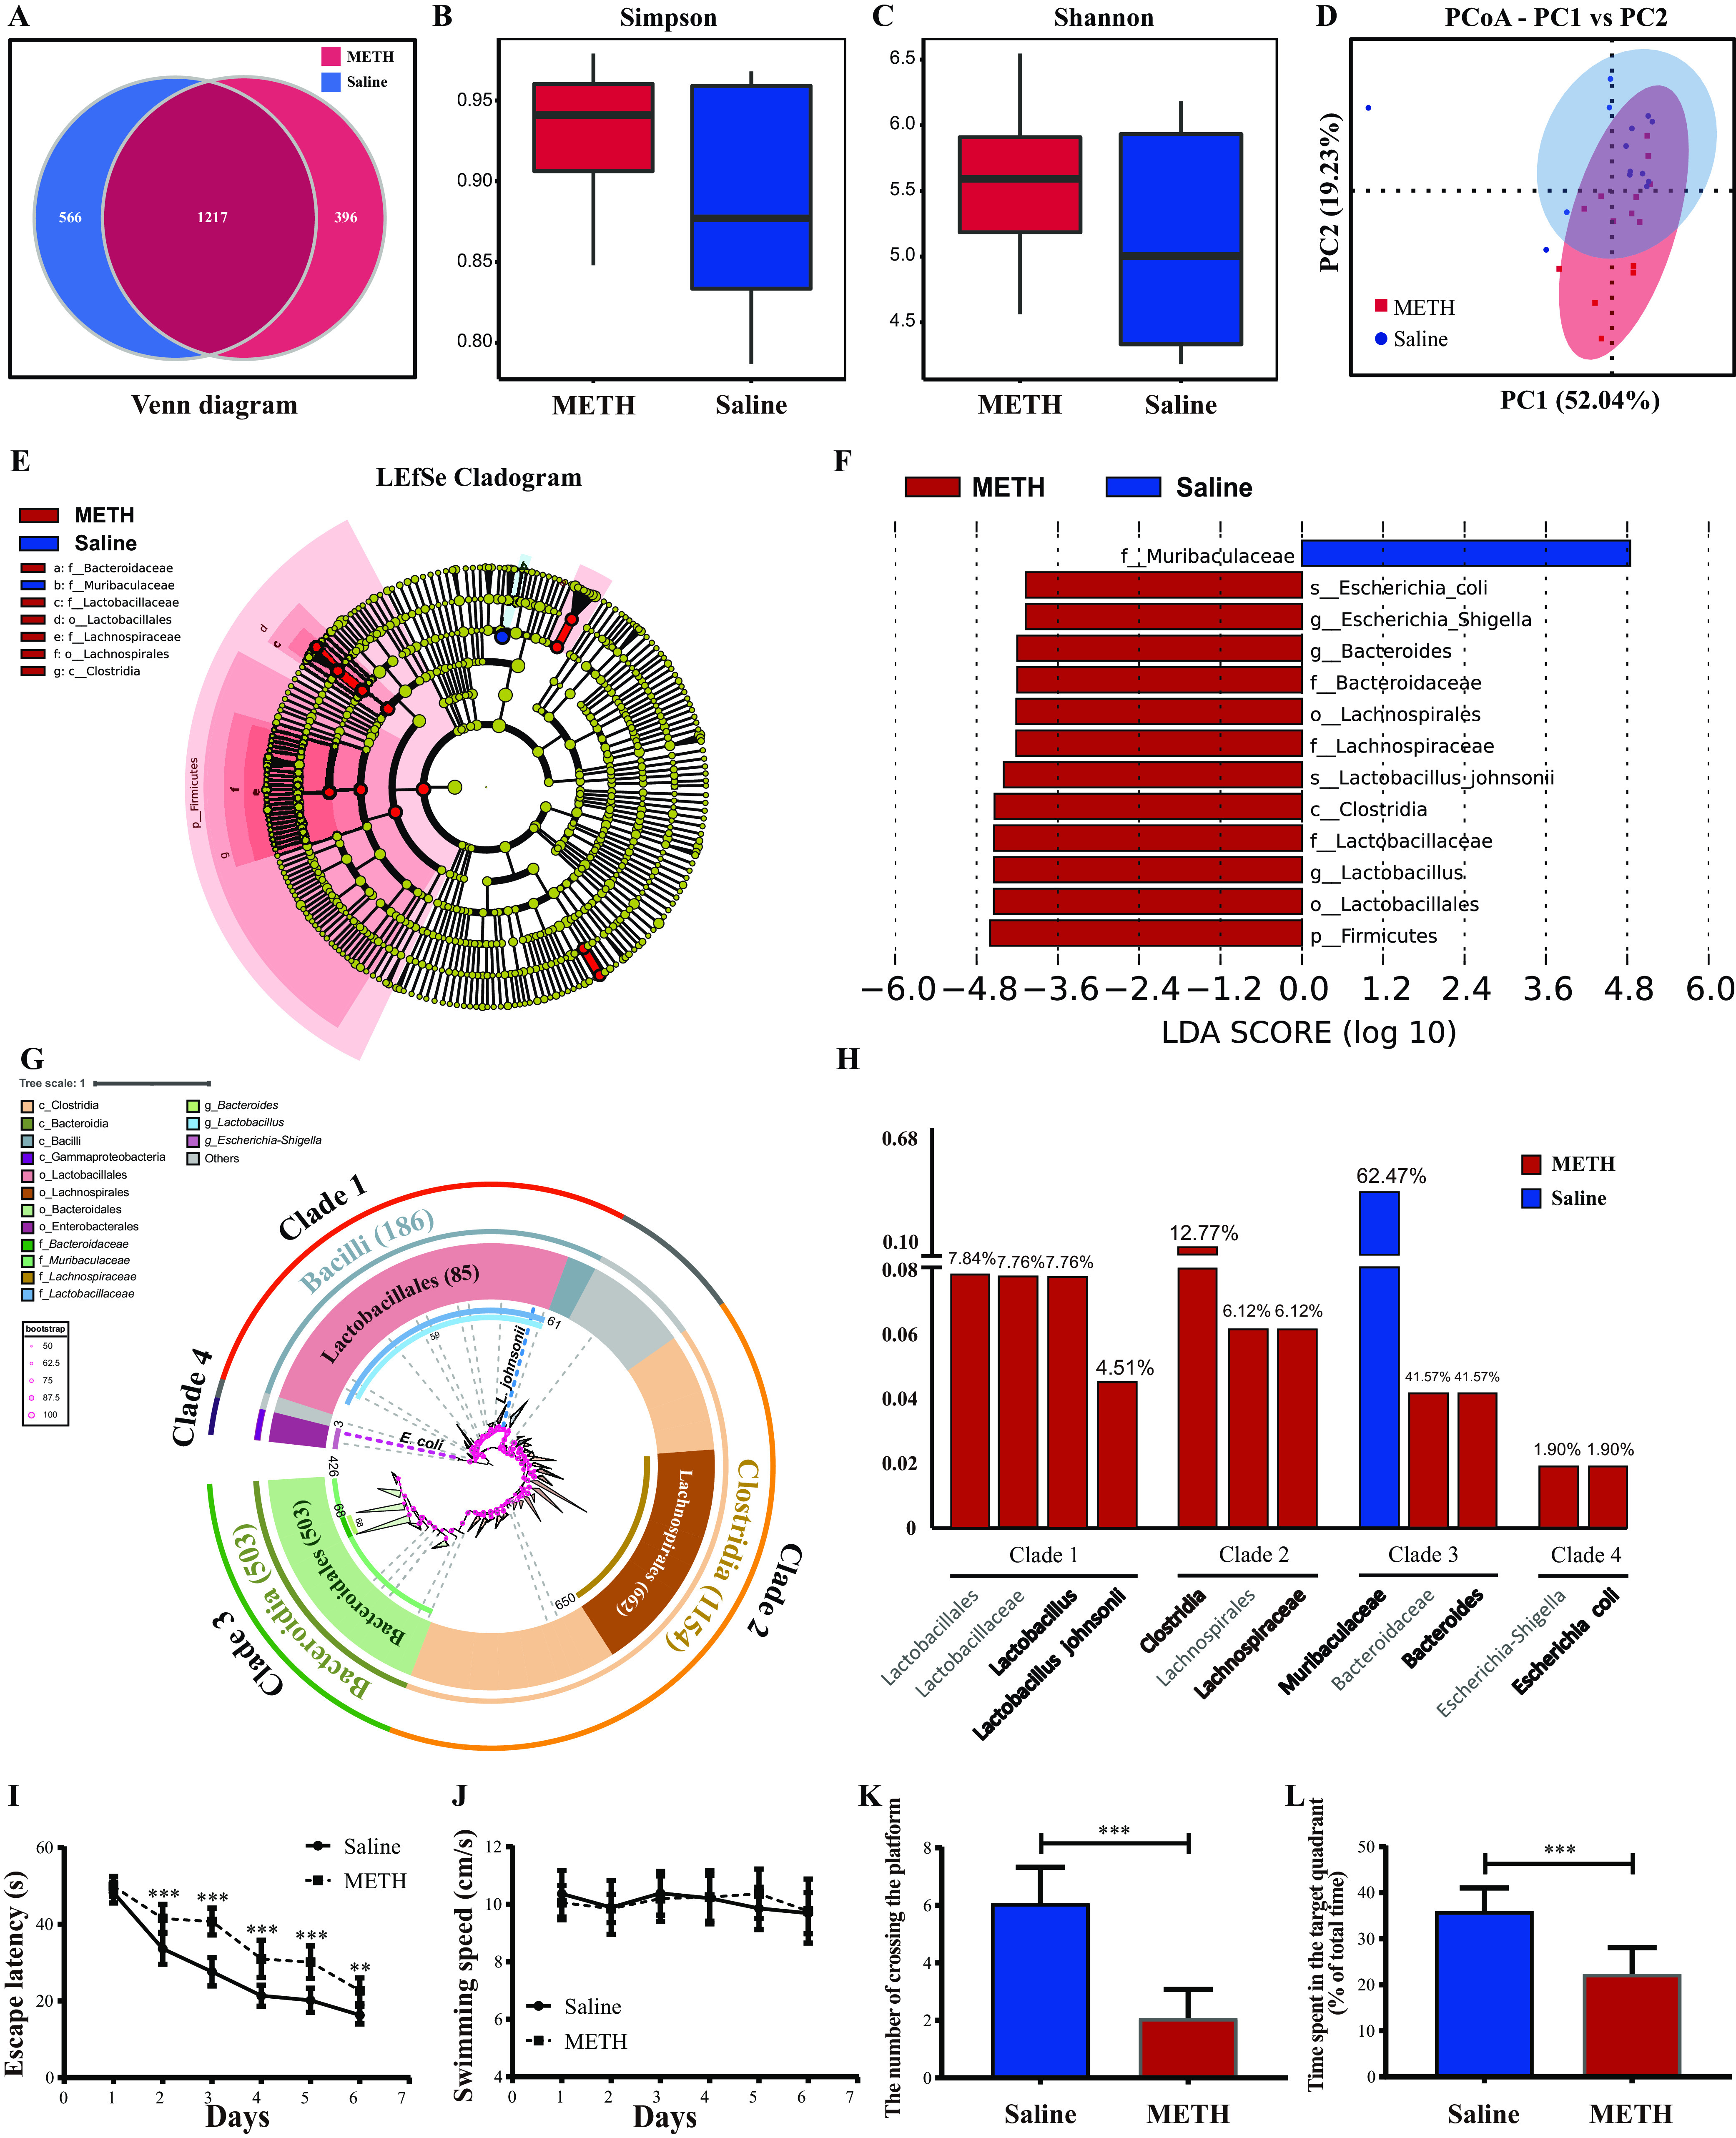
FIG 1.

Chronic METH exposure induced gut microbiome dysbiosis and spatial learning and memory impairment. (A) Venn diagram of unique and shared OTUs in the METH and saline groups. (B and C) Simpson and Shannon indexes show the difference in alpha diversity between the two groups. (D) PCoA plot based on weighted UniFrac distances, demonstrating significant changes in the gut microbiota after chronic METH exposure. Axis 1 (PC1) explained 52.04% of the variation, and axis 2 (PC2) explained 19.23% of the variation. (E) LEfSe cladogram. The blue and red colors represent distinct taxa in the saline and METH groups, respectively, whereas yellow indicates no significant differences between the groups. (F) LDA value distribution histogram. Taxa with LDA values greater than 4 are presented. (G) Evolutionary relationships of characteristic taxa depicted with a maximum-likelihood phylogenetic tree generated by IQtree software and visualized with iTOL. Numbers are the numbers of OTUs belonging to each taxon. (H) Relative abundance histogram of distinct taxa. (I and J) Escape latency and the swimming speed during the place navigation of the MWM test showed that spatial learning ability was impaired after chronic METH exposure. (K and L) Numbers of times crossing the platform from a previously determined spot and time spent in the target quadrant (percent of total time) during the spatial probe of the MWM test indicated that spatial memory ability was impaired after chronic METH exposure. Data are means and SEM (n = 12 to 14). **, P < 0.01; ***, P < 0.001.
