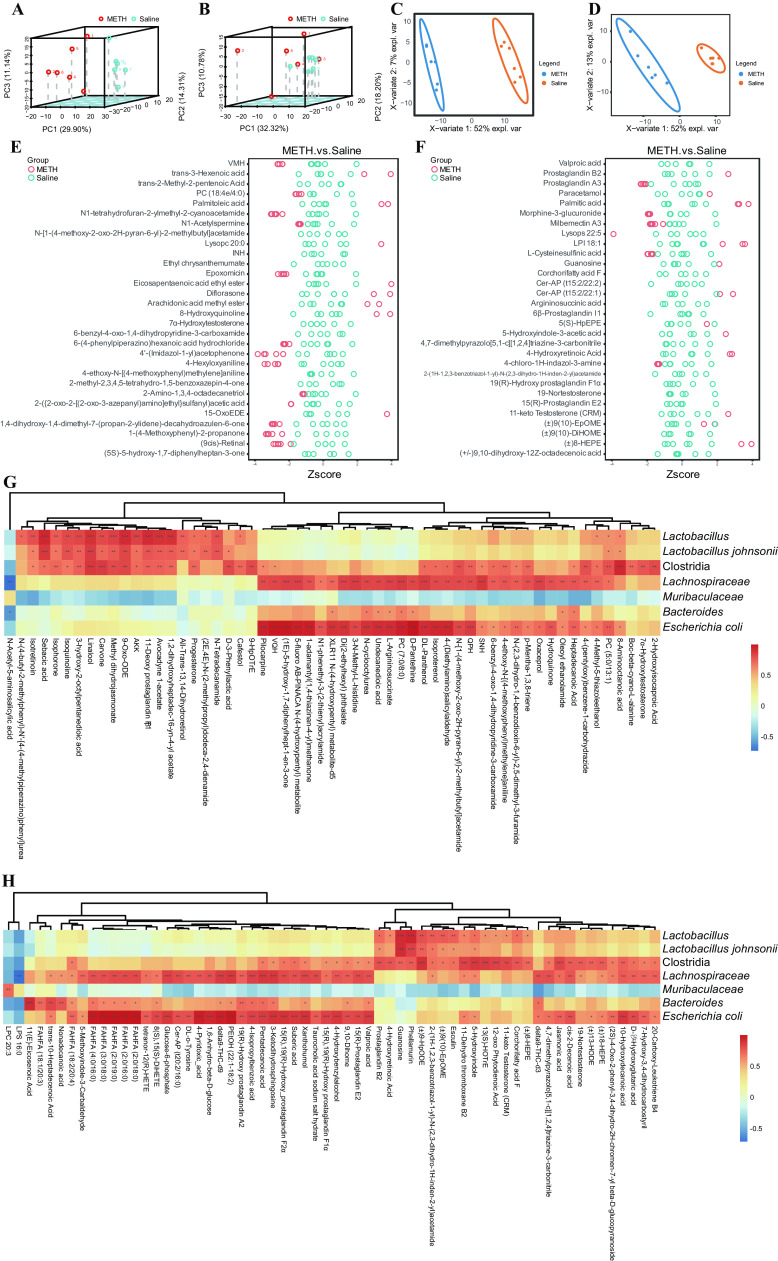
FIG 2.
METH exposure altered the gut microbiota metabolome. (A) PCA plot of fecal metabolites in ES+. (B) PCA plot of fecal metabolites in ES−. (C) PLS-DA analysis of fecal metabolites in ES+. (D) PLS-DA analysis of fecal metabolites in ES−. (E) Different fecal metabolites between the METH and saline group in ES+ (top 30 results). (F) Different fecal metabolites between the METH and saline group in ES− (top 30 results). (G) Metabolites which showed significant correlation with critical microbiota taxa in ES+. (H) Metabolites which showed significant correlation with critical microbiota taxa in ES−. n = 6 for each group. *, P < 0.05; **, P < 0.01; ***, P < 0.001.

