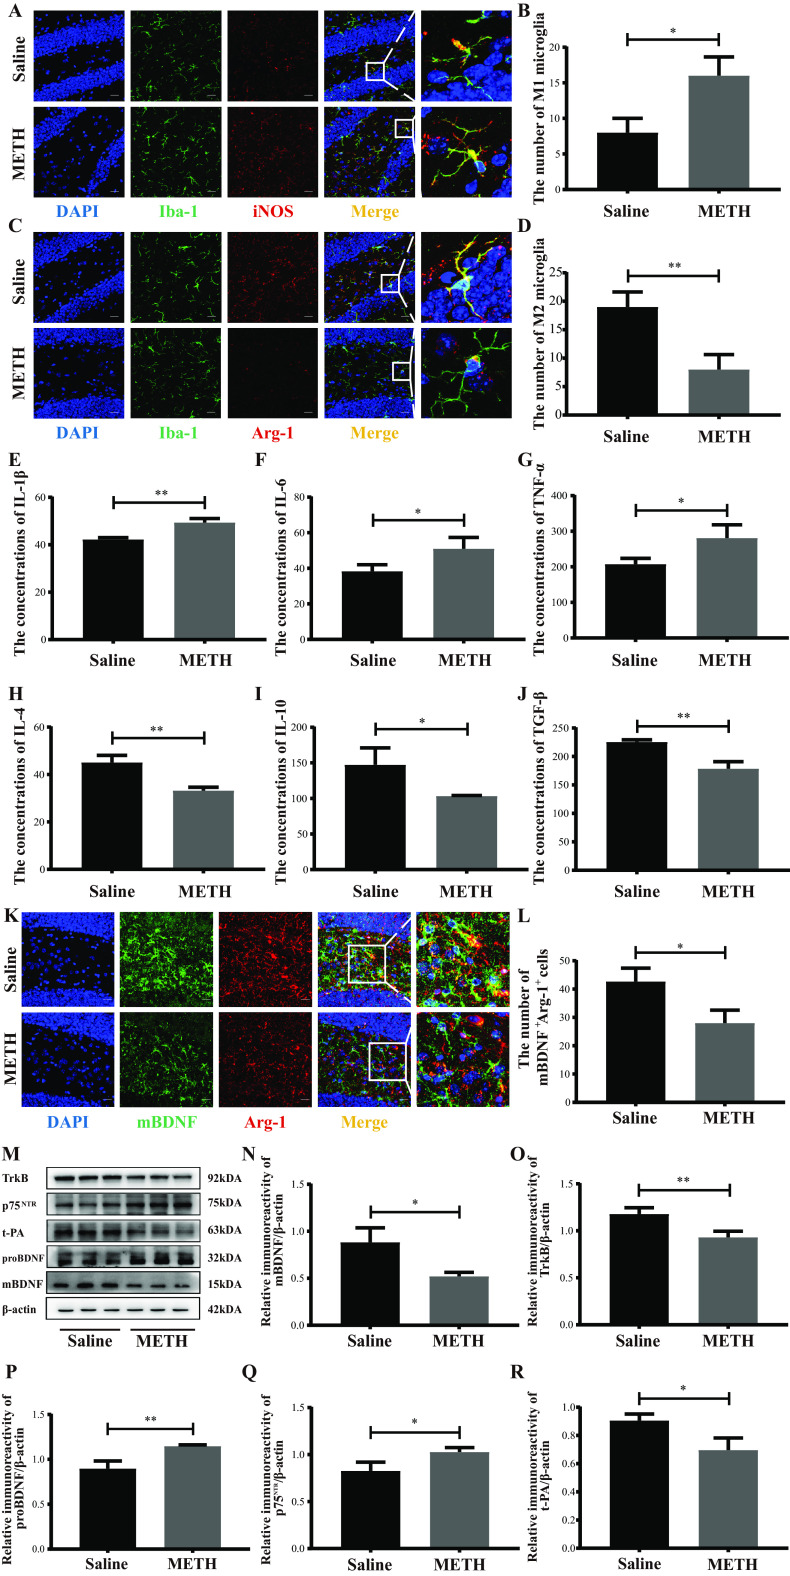
FIG 4.
Changes in microglial M1/M2 phenotypes and the secreted factors in the hippocampus after chronic METH exposure. (A and C) Representative immunofluorescence staining images (magnification, ×400; bar = 20 μm) of nuclei (DAPI; blue), total microglia (Iba-1+; green), M1 microglia (iNOS+; red), and M2 microglia (Arg-1+; red) in the hippocampal dentate gyri of different groups. (B and D) Quantitative analysis of the number of Iba1+ iNOS+ cells (M1 microglia) and Iba1+ Arg-1+ cells (M2 microglia) in the hippocampal dentate gyri of different groups. (E to J) Levels of proinflammatory cytokines (IL-1β, IL-6, and TNF-α) and anti-inflammatory cytokines (IL-4, IL-10, and TGF-β) in the hippocampi of different groups. (K) Representative immunofluorescence staining images (magnification, ×400; bar = 20 μm) of nuclei (DAPI; blue), M2 microglia (Arg-1+; red), and mBDNF (mBDNF+; green) in the hippocampal dentate gyri of different groups. (L) Quantitative analysis of the number of Iba1+mBDNF+ cells in the hippocampal dentate gyri of different groups. (M) Representative protein immunoblots showing the expression of proteins regulating the BDNF signaling system (mBDNF, TrkB, proBDNF, p75NTR, and t-PA) of different groups. (N to R) Densities of immunoblot bands of mBDNF/β-actin, TrkB/β-actin, proBDNF/β-actin, p75NTR/β-actin, and t-PA/β-actin in the hippocampi of different groups. Data are means and SEM (n = 10 to 12). *, P < 0.05; **, P < 0.01.

