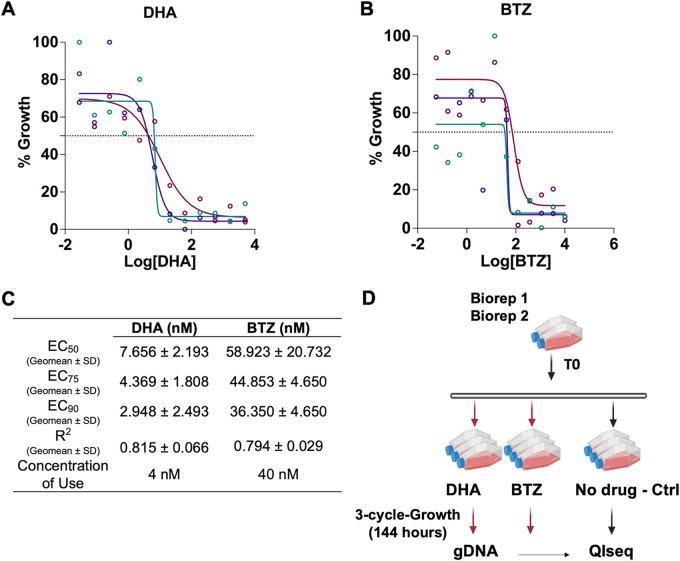
FIG 1.
Dose-response curves of (A) dihydroartemisinin (DHA) and (B) bortezomib (BTZ). Standard 72-h drug assays were performed using NF54 (see Materials and Methods); the different colors represent the biological triplicates. (C) Effective concentrations (EC50, EC75, and EC90), R2 (coefficient of determination) values, and drug concentrations used for the half-K pB library drug phenotypic screens; (D) experimental design for DHA and BTZ phenotypic screens. The half-K library (n = 553 mutants) was exposed to three cycles (144 h) of continuous drug pressure of sublethal doses of DHA and BTZ. Control flasks were cultured continuously in parallel without drugs. After 144 h of continued drug pressure, the cultures were harvested, and insertion sites were identified by QIseq (quantitative insertion-site sequencing) see (Materials and Methods) (Data Set S1).

