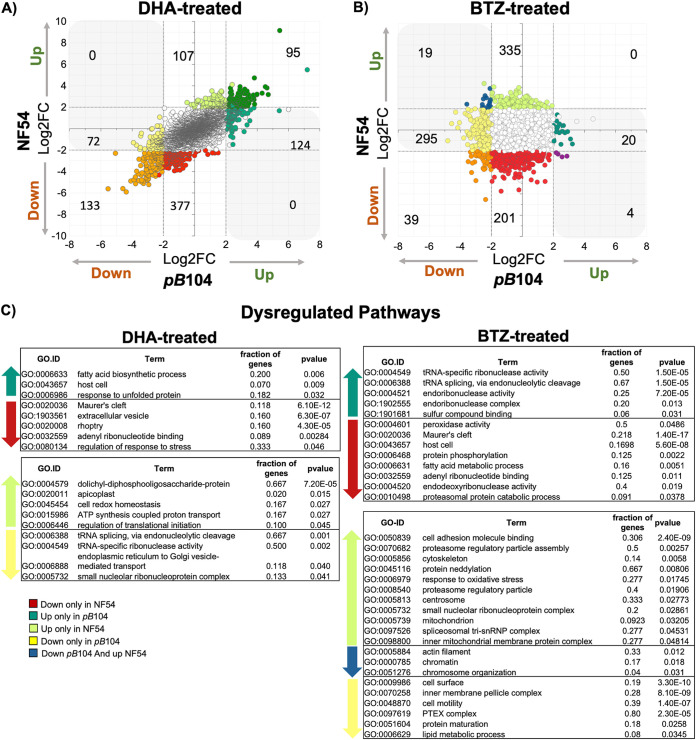
FIG 4.
Differential expression of genes reveals parasites with dysregulated expression in the piggyBac mutant sensitive to dihydroartemesinin (DHA) and bortezomib (BTZ). Shown is the scatterplot of the log2 fold change of individual genes for pB104 (x axis) compared to NF54 (y axis) in (A) DHA and (B) bortezomib. Point color indicates the category of expression genes used to Gene Ontology (GO) enrichment functional analysis (see Materials and Methods) (Data Set S6): white points represent neutral genes (i.e., genes with no significant changes), orange points represent genes downregulated in both parasite lines, red points represent genes downregulated only in NF54, yellow points represent genes downregulated only in pB104, light green points represent genes upregulated only in NF54, dark green points represent genes upregulated in both parasite lines, median green points represent genes upregulated only in pB104, blue points represent genes downregulated in pB104 and upregulated in NF54, and dark reddish-purple points represent genes downregulated in NF54 and upregulated in pB104. Shading in gray in the upper left and lower right quadrants signifies genes that are dysregulated—genes with a different direction of regulation comparing pB104 and NF54. (C) Relevant GO terms of dysregulated pathways under DHA and BTZ treatment: genes downregulated only in NF54, upregulated only in pB104, upregulated only in NF54, downregulated in pB104 and upregulated in NF54, and downregulated only in pB104. Significant terms were determined by two-tailed Fisher/elim-hybrid test (P ≤ 0.05) (Data Set S6).

