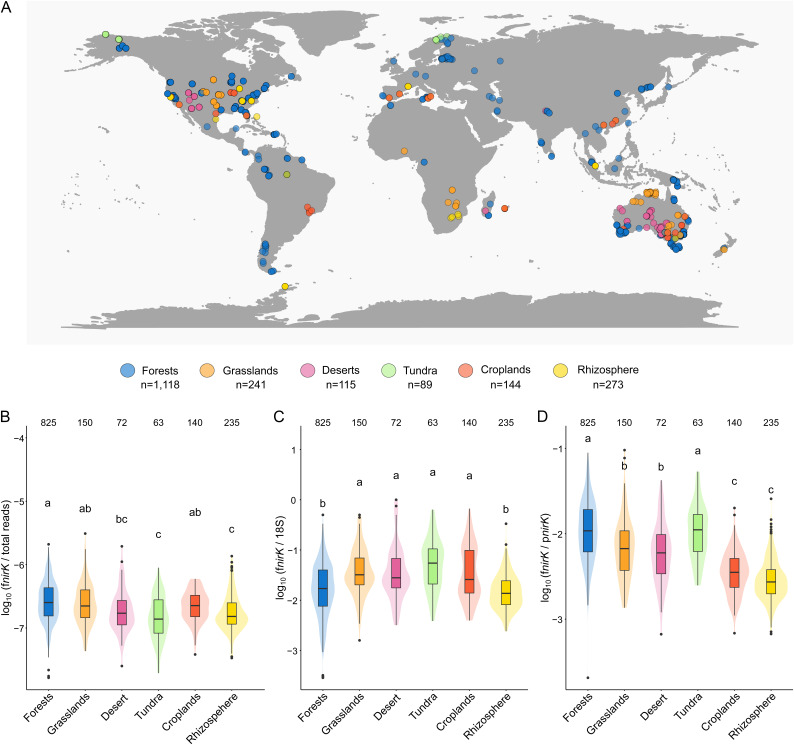
FIG 1.
Origins of metagenomes and abundance of fungal nirK in terrestrial biomes. (A) 1,980 metagenomes representing 608 sampling locations across the globe. The sampling locations of 41 rhizosphere samples are not indicated due to the absence of associated geographic coordinates. Made with Natural Earth. (B) Fungal nirK (fnirK) gene fragment counts, normalized to the total number of reads per metagenome. (C) Abundance of fnirK, relative to fungal 18S rRNA gene (18S) fragment counts. (D) Abundance of fungal, relative to prokaryotic, nirK (pnirK) gene fragment counts. Different letters indicate significant differences between biomes (ANOVA, Šidák-corrected pairwise comparisons, P < 0.05). The numbers above the boxplots in panels B to D indicate the number of metagenomes within each biome with at least one fungal nirK hit. The box limits represent the interquartile range (IQR), with the median values being represented by the centerline. Whiskers represent values that are ≤1.5 times the upper and lower quartiles, whereas points indicate values outside this range. The shaded areas show kernel density estimations, indicating the distribution of the data.

