FIG 5.
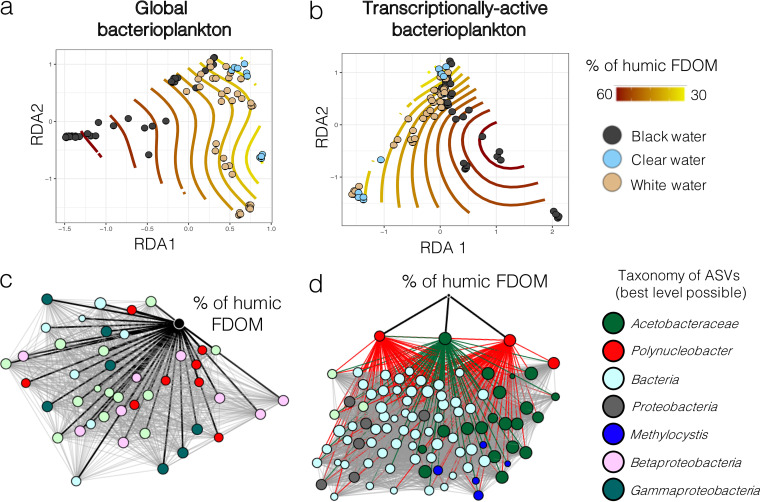
The concentration of humic FDOM correlated with the structure of global and transcriptionally active bacterioplankton communities. (a, b) Ordisurf plots (i.e., RDA plots fitted with isolines describing humic FDOM relative abundance variations) based on the structure of global (a) and transcriptionally active bacterioplankton (b). The samples are colored according to their water type. (c, d) Spearman correlation-based networks of coabundance between humic FDOM and bacterial ASVs from the global bacterioplankton (c) or transcriptionally active bacterioplankton (d) communities. For ease of viewing, only the taxa that correlated directly with humic FDOM or that were direct neighbors of such taxa were kept for network construction. The nodes are colored according to their taxonomic assignation (at the best level possible). Labels in the legend for panels c and d refer to the best level of taxonomic assignation reached for these ASVs. The black lines in panels c and d represent direct correlations between humic FDOM and specific ASVs, while gray lines represent indirect correlations. All correlations in panels c and d are positive correlations. In panel d, lines from the three nodes directly correlated with humic FDOM are colored according to their node taxonomic assignation to highlight the indirect effect of humic FDOM on the transcriptionally active bacterioplankton community. These lines sre not colored in panel c for ease of viewing. FDOM, fluorescent dissolved organic matter; ASV, amplicon sequence variant.

