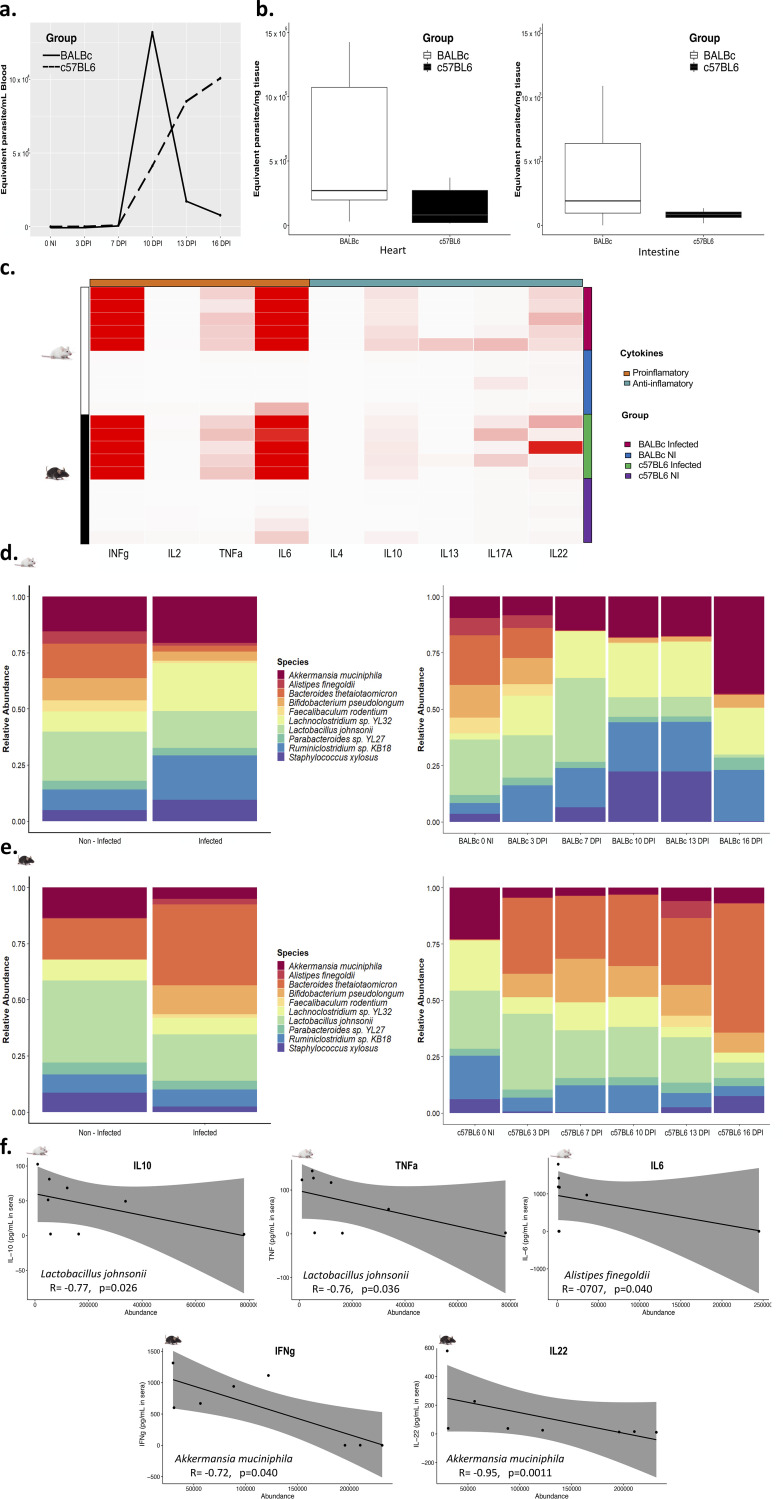
FIG 1.
(a) Parasite burdens from total DNA were calculated by real-time PCR, and a standard curve was used to calculate the parasite equivalents/mL in blood. A solid line represents the parasite burden in BALB/c infected mice (n = 5), and a dashed line represents the parasite burden in C57BL/6 infected mice (n = 5). (b) Parasite burden in cardiac tissue and intestinal tissue. A Student t test was used to compare burdens in cardiac tissue, and a Wilcoxon signed-rank exact test was used to compare burdens in intestinal tissue. (c) Heatmap showing the profile of anti-inflammatory and proinflammatory cytokines according to the evaluation group. The average linkage was used as the clustering method. (d) The relative abundance of the 10 most abundant bacterial species in BALB/c mice is shown for the control (n = 5) and infected (n = 5) groups (left) and each of the measurement points (right). (e) The relative abundance of the 10 most abundant bacterial species in C57BL/6 mice is shown for the control (n = 5) and infected (n = 5) groups (left) and each of the measurement points (right). NI, noninfected; DPI, days postinfection. (f) Correlation analysis between abundance values of Lactobacillus johnsonii, Alistipes finegoldii, and Akkermansia muciniphila and levels of cytokines IL-10, TNF-α, IL-6, IFN-γ, and IL-22. A Spearman correlation test was implemented, the R coefficient, and P value are indicated.

