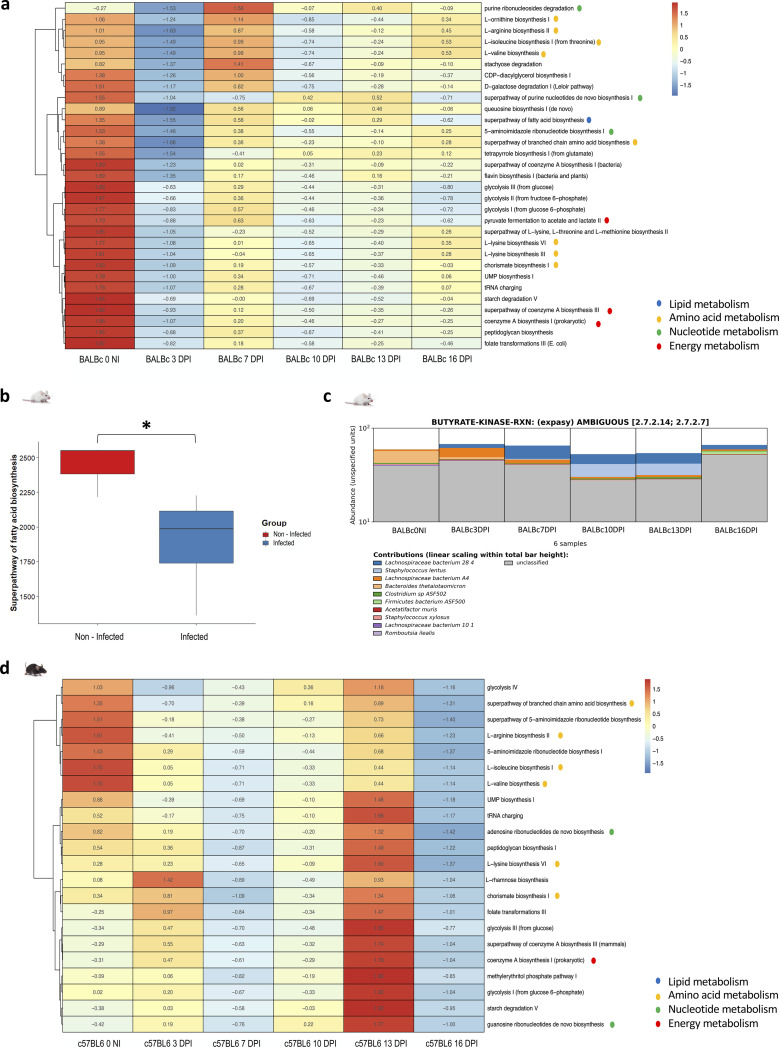
FIG 2.
Functional analysis from metagenomic data. The main results were obtained by Humann3, and the R package, Maaslin2, using a multivariate mixed-effects model. (a and d) Metabolic pathways involving genes with differential abundances between infected and noninfected mice for BALB/c (a) and C57BL/6 (d) mice. Heatmaps were created with MicrobioSee using Ward’s linkage method for hierarchical cluster analysis. The metabolic pathways to which the different processes belong are represented by different colored dots indicated in the legend. (b) Abundance of reads related to the superpathway of fatty acid biosynthesis as observed for noninfected (NI) and infected BALB/c mice. A Student t test was used to compare these groups. (c) Bar plot obtained from HUMAnN 3.0 for butyrate kinase that was modified in terms of abundance of reads during T. cruzi infection. The figure includes the regrouping of bacterial species and the classification of the samples by evaluation point. *, P < 0.05. BALB/c infected mice, n = 5; BALB/c noninfected mice, n = 5; C57BL/6 infected mice, n = 5; C57BL/6 noninfected mice, n = 5.

