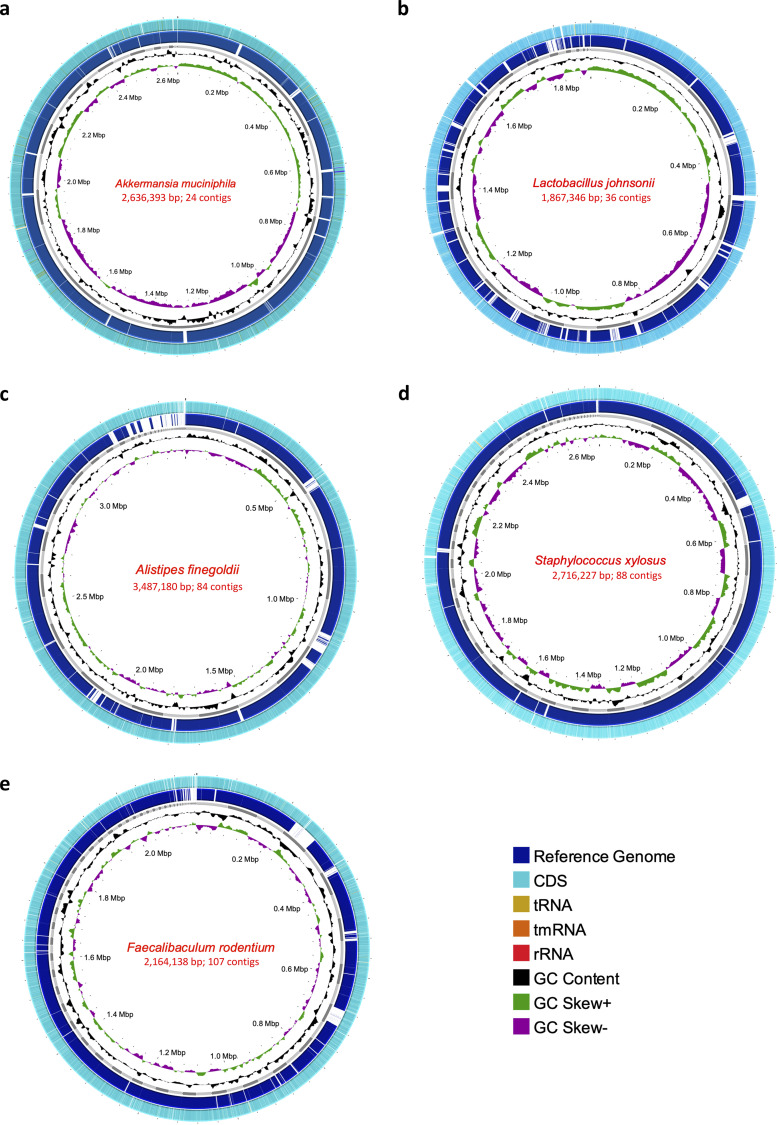
FIG 3.
(a to e) Genomes (MAGs) reconstructed for Akkermansia muciniphila (a), Lactobacillus johnsonii (b), Alistipes finegoldii (c), Staphylococcus xylosus (d), and Faecalibaculum rodentium (e). In each of the MAGs, the size in base pairs and the resulting number of contigs of each genome obtained can be seen. For each case, the innermost ring represents the CG skew (green and purple). Subsequently, the %GC value is found (black). The next ring shows the resulting assembled genome (MAG) contigs (gray). Also, the reference genome for each genome (dark blue), which was aligned by BLAST and the white areas represent regions where no identity with the assembled MAG was found. Finally, in the outer ring, there are the coding regions obtained by Prokka, where coding regions (CDS) (light blue), tRNA (light brown), tmRNA (orange), and rRNA (red) can be identified.

