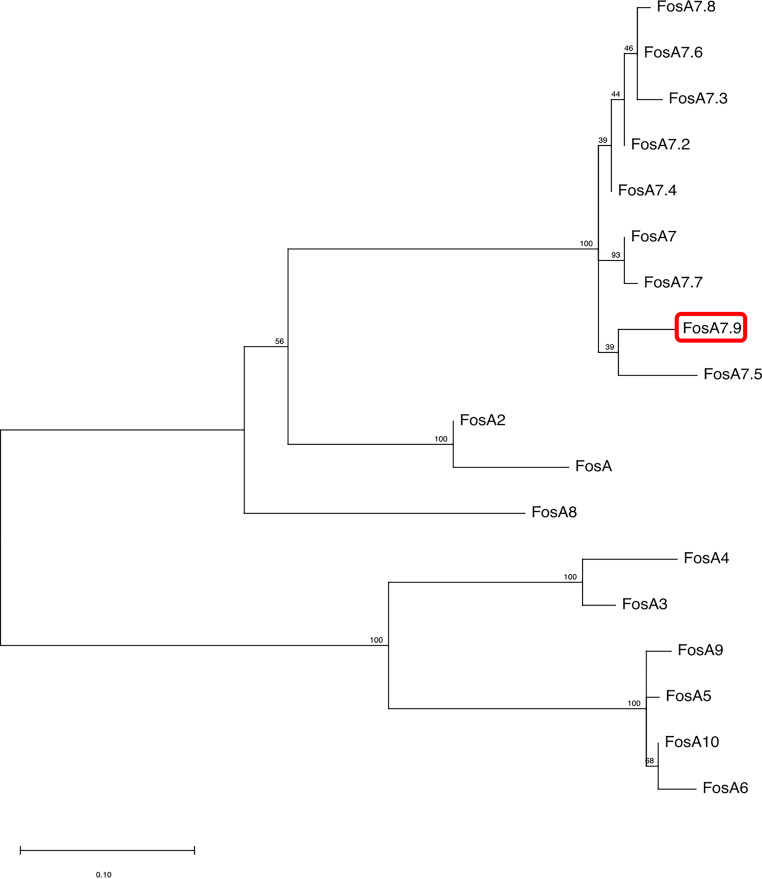
FIG 4.
The evolutionary analysis and phylogenetic tree of FosA proteins found in Enterobacterales were inferred by using the maximum-likelihood method and JTT matrix-based model using MEGA 11. The tree with the highest log likelihood (−1,275.39) is shown. The percentage of trees in which the associated taxa clustered together is shown above the branches. The tree is drawn to scale. The red rectangle indicates the new FosA7.9 in C. freundii.

