
Figure 2.
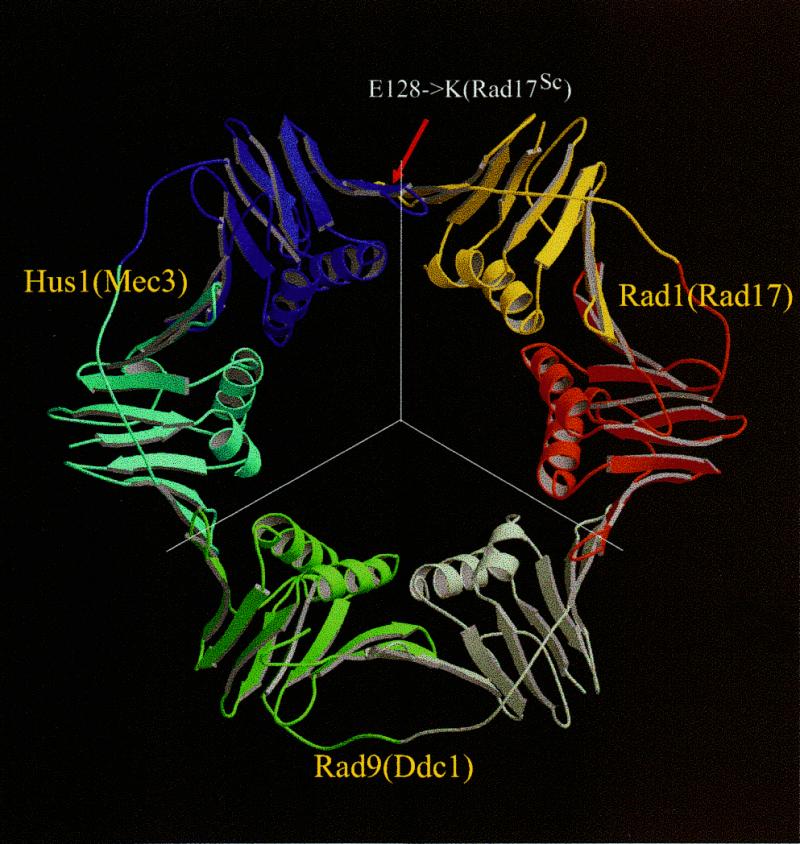
Model of the Rad1/Rad9/Hus1 complex based on the PCNA structure. Line segments indicate boundaries between individual monomers. Coloring corresponds to that used in sequence–structure alignments in Figure 1. The red arrow points to a residue position corresponding to a point mutation in Rad17Sc that prevents complex formation with Mec3Sc. This and other structural figures were prepared with Molscript (53) and Raster3D (54).