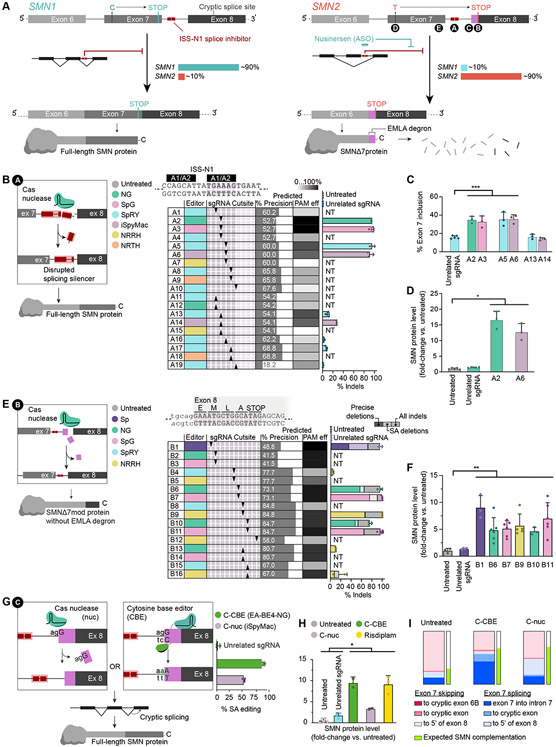
Fig. 1. Editing SMN2 regulatory regions.
(A) Genomic SMN exons 6 to 8, and SMN mRNA and protein products. (B) Nuclease editing strategy and genome editing outcomes of ISS-N1 targeting (strategy A). The table shows combinations of six nucleases, paired with ten sgRNAs complementary to the top (A1-10) or bottom strand (A11-19) identified by arrows that show the DSB site of the sgRNAs relative to the sequence above. (C) Exon 7 inclusion in SMN mRNA after editing, as indicated, measured by automated electrophoresis. (D) SMN protein levels after editing, as indicated, normalized to histone H3. (E) Nuclease editing strategy targeting and genome editing outcomes of targeting the first five codons of exon 8 (strategy B). The table shows combinations of five nucleases, paired with nine sgRNAs complementary to the top (B1-12) or bottom strand (B13-16) identified by arrows that indicate their DSB site, as above. (F) Total SMN protein levels after editing. (G) Nuclease and cytosine base editing strategies and genome editing outcomes of 3’-splice acceptor disruption at exon 8 (strategy C). (H) SMN protein levels following C-nuc and C-CBE editing or treatment with risdiplam, normalized to histone H3. i) Distribution of SMN2 transcript variants after C-nuc and C-CBE editing. Experiments are performed in Δ7SMA mESCs, NT=no treatment, *≤0.05, **≤0.01, ***≤0.005.

